The Weight of tariffs on US Trade Deficit
The American trade deficit at the time of Trade War
Published by Marzia Moccia. .
United States of America Trade balance Trade war Global economic trends
ExportPlanning US International trade database has been updated with the Q3-2019 data in recent days [1].
The data available range from the first quarter of 2011 to the third quarter of 2019 and makes it possible to map US trade on quarterly basis, by Partner (152 Ulisse countries) and by product (over 10 thousand products of the Harmonized Tariff Schedule classification).
The availability of updated information makes it possible to analyse the first effects of the protectionist trade policy strongly supported by the Trump Administration.
The evolution of US trade flows
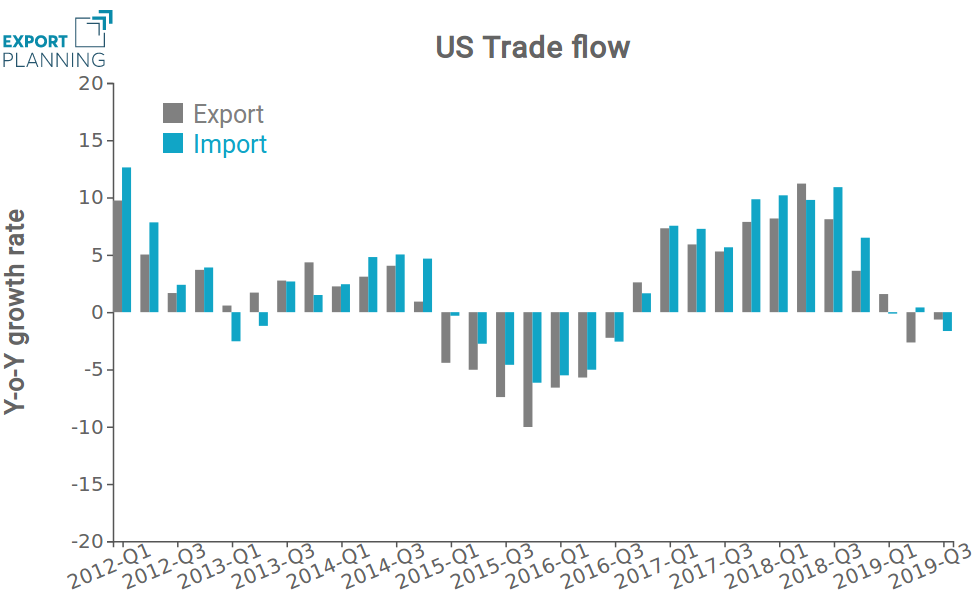
Source: ExportPlanning
It is possible to make two main considerations by comparing the year over year growth rate of American import and export flows:
- the growth of American imports and exports has been substantially zeroed in recent quarters. If, on the one hand, protectionist policies have substantially reduced the growth of American imports, on the other hand the international situation and the retaliatory actions of commercial partners have contributed to eliminating even the growth of American exports;
- American trade policy has allowed a gradual realignment of US import and export rates. In fact, if the 2014-2018 period was characterized by an increase in imports almost always higher than that of exports, in 2019 the data show a situation of greater balance between the two trade flows, with a greater variation in exports (or one less fall) than that of imports for two quarters out of three.
The alignment between the import and export growth rate has stabilised the US trade balance of goods (see the following chart).

Source: ExportPlanning
US trade balance of goods has experienced a progressive deterioration over the last few years, particularly accelerated during 2016 and the first three quarters of 2018, where it reached almost $ -240 billion. However, over the last year the trade deficit appears to have entered a stabilization phase.
On the basis of these results, the US protectionist policy would seem to have succeeded in halting the worsening of the trade deficit, without however having significantly reduced it.
In fact, the actions seem to have had very limited benefits, especially if we consider the relative costs both in terms of slowing global demand and progressive geopolitical isolation of the United States from multilateral logics.
As already written in the previous article US Trade Deficit after Trade War Tariffs, there were several factors that led to this result.
A first factor is represented by the presence of a substitution effect, for which the minor imports from the countries burdened by duties have been replaced, at least in part and in the short term, by imports coming from other countries and not by American producers.
A second reason is instead linked to the retaliatory effects adopted by countries hit by the tariffs, first of all by China, which have worsened the performance of American exports, especially given the current economic situation.
Focusing on bilateral trade relations, American trade deficit appears to be strongly inhomogeneous among different countries. The following graph shows the change recorded between Q3-2018 and Q3-2019 by country, thus making it possible to immediately distinguish the countries to which the US trade balance has improved from those to which it is instead got worse. The US trade deficit has worsened towards those countries located at the bottom right of the graph, below the yellow line, on the contrary it has recorded an improvement towards those countries that are located above the yellow line.
Source: ExportPlanning.
The graph highlights three countries that has registered a net trend reversal: China, Saudi Arabia and Canada.
China represents the country to which the American trade deficit has improved most significantly because of tariff measures that have involved the two fronts since the summer of 2018. Furthermore, the significant visible deterioration during the third quarter of 2018 is attributable to the stocking up effect for which the American demand for Chinese goods subject to the next tariff has risen sharply in the months immediately prior the tariff provision.
China is followed by Saudi Arabia and Canada. In the case of Saudi Arabia, the improvement is mainly due to the sharp downsizing of American oil imports, while in the case of Canada it is linked to a reduction in the exchange of raw materials between the two countries, mainly due to the pre-existing tariffs on steel and aluminum.
In contrast, the trade balance towards Vietnam, Taiwan, but also South Korea and India, worsens significantly. It is precisely these countries, in fact, that have partially replaced China, thanks to a supply system very similar to the Chinese competitor.
Among the countries to which the US trade balance has deteriorated, there are also Switzerland, Japan and also the main EU markets, such as Germany, France, Italy and the Netherlands.
If the real objective of the trade war started by the Trump administration against China is the rebalancing of the US trade deficit, and not the technological leadership, then in the future we might observe protectionist actions also towards other countries, especially towards those with a positive bilateral trade balance.
[1] Trade data are based on US trade declaration available at the usatrade.census.gov site until August 2019. Q3-2019 is estimated using StudiaBo nowcasting techniques.
You may be interested in:

US Tariffs: Even More Uncertainty?
Published by Marzia Moccia. .
United States of America Uncertainty Trade war Global economic trends“Tariff is the most beautiful word in the dictionary”, stated Donald Trump during his second campaign for the White House, clearly foreshadowing the central role that tariffs would play in shaping t}... [ Read all ]

EU–China: the evolution of the trade relationship and new sectoral balances
Published by Veronica Campostrini. .
Importexport Trade balance Foreign markets Foreign market analysisThe evolution of the trade balance in goods between the European Union and China today represents one of the most relevant lenses through which to understand the new asymmetries of international trade}... [ Read all ]

Measuring the effects of U.S. tariffs: a comparison among major trading partners
Published by Simone Zambelli. .
Europe United States of America Export Economic policy Foreign market analysisMeasuring the effects of U.S. tariffs: a comparison among major trading partners [ Read all ]