World trade: -20% in April
StudiaBo estimates indicate a 20% drop in world trade in quantity in April 2020 compared to the corresponding month of 2019
Published by Giulio Corazza. .
Uncertainty Conjuncture Total goods Global demand Global economic trends
The world economy is going through a phase of deep crisis of which its intensity is still uncertain. During April and May the industrial production in Europe and North America has suffered the sharpest decline. The first data about electricity consumption suggest a partial recovery in June. On the demand side, April and May are also reported as the worst months of the year. The simultaneous collapse in both supply and demand inevitably translated into a sharp drop in international trade.
However, the extent of this collapse is still very uncertain. In fact, not all countries are equally quick to collect, process and publish their statistics about foreign trade flows.
The U.S. Department of Commerce, for instance, makes available data from U.S. business declarations with a delay of just over a month, while central statistical offices of many developing countries have delays of many months.
StudiaBo estimation methodology
An updated estimate of the dynamics of world trade must therefore address the trade-off between the representativeness of the sample of countries considered and an update of the same estimate.
If we only consider countries that are faster in publishing foreign trade data, it is possible to build an up-to-date measure of the dynamics of international trade, but with less representation of the population of the countries of the world. Conversely, if you want to have a sample that is close to the entire population, you must necessarily consider, in addition to the countries of the previous sample, those countries that are lagging behind in their declarations.
On the basis of these considerations it is possible to build two different country samples. A relatively small one, including all countries that have already published statistics for April 2020. The second one, more extensive, consists of the countries that have published statistics at least for December 2019. For the second sample the data of all countries are updated to April 2020 using nowcasting techniques1.
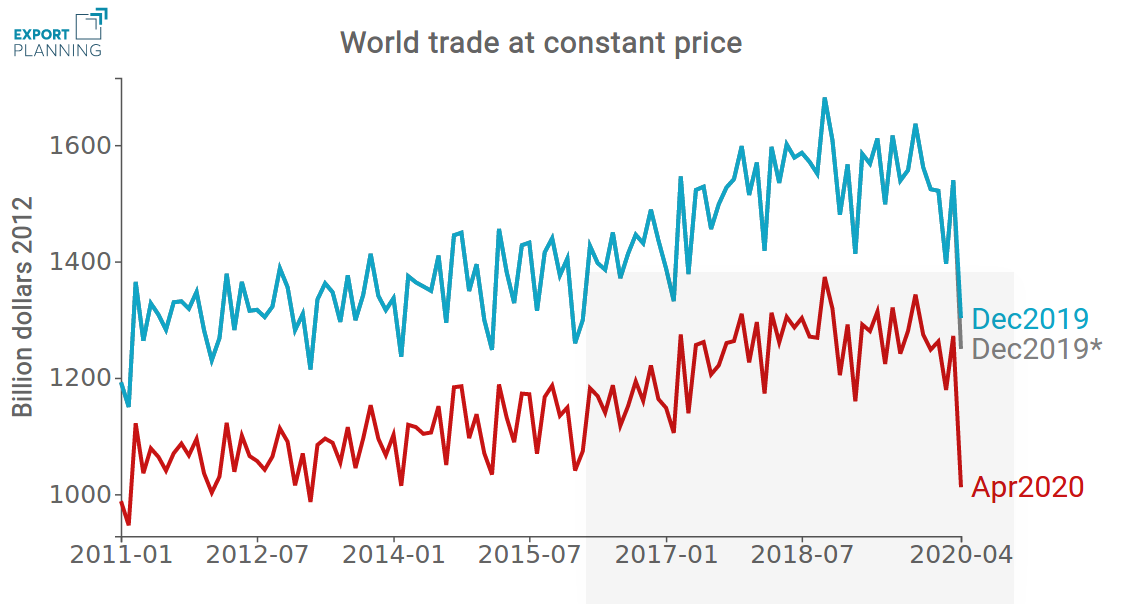
The graph below shows the monthly time series of total imports at constant prices for the two country samples. The 'Apr2020' series refers to the sample of countries that have already reported data for April 2020; the 'Dec2019' series refers to the sample of countries that have published at least the statistics for December 2019.

Source: ExportPlanning elaborations
As can be see from the graph, even if the series show different levels, they present very similar dynamics. This is due to the different number of countries examined in the samples. These patterns present a difference in the month of April 2020, in which the series related to the sample Apr2020 registers a more accentuated fall compared to the Dec2019 series. The reason is related to the fact that ARIMA models are reliable in making short-term forecasts provided that the data generating model does not undergo significant changes. What happened in March and especially in April 2020 is an economic shock such as to distort the inertial processes of evolution of trade flows, thus making the estimates made with these statistical models inaccurate. In order to overcome this limitation, in the series indicated with "Dec2019*" the missing data for countries whose declarations are not yet available until April 2020 have been estimated using the "mirror flow" technique. This technique consists in estimating the flows of a country lagging behind in its declarations with the 'mirror' declarations of the partner country. Each foreign trade flow, in fact, is declared twice: once by the exporting company and once by the importing one. For those countries that have not yet published data for one or more months of 2020 it is possible to use partners' mirror declarations to estimate the dynamics of their flows. The use of this technique allows to obtain the same results as nowcasting with ARIMA models, except for April where the mirror approach is much more reliable.
April 2020: 20% drop in world trade at constant prices
In order to highlight more clearly the differences in dynamics, the following graph shows the trend rates of change (compared to the corresponding month of the previous year) of the three series.

Source: ExportPlanning elaborations
The graph shows how, after a first part of 2018 in which world trade grew at rates above 5%, the start of the US-China trade war essentially wiped out the growth of world trade, with a prevalence of negative months in the second part of 2019 and the first months of 2020. The lockdown policies implemented on a global scale then resulted in April in a collapse of world trade at constant prices above 20%.
World trade in euro
The following graph shows the growth rates in world trade both at constant prices and in current euro, including the related prices. Due to a substantial stability of prices in euros, the decrease in world trade in euro was 20% in April, equal to the variation registered at constant prices.

Source: ExportPlanning processing
For companies that invoice in euro this is the data that allows to have a measure of the collapse of world trade, useful as a benchmark to make comparisons with the variation of the company sales abroad.
Conclusions
From the analysis carried out in the article it is clear that the effects of the global health crisis and the resulting lockdown policies on international trade in goods occurred mainly in April 2020. The strong climate of uncertainty about the continuation of the virus containment measures had a negative impact on international trade. Electricity consumption data show a further contraction in May 2020 and a partial recovery in June, thus can be expected a particularly negative second quarter.
1 ARIMA models were used at a detailed level of 6-digit Harmonized System product code and reporting country.


