World trade recovery
In June and July 2020 world trade recorded a clear recovery compared to the collapses registered in April and May
Published by Giulio Grisanti. .
Global demand Global economic trendsThe availability of import and export declarations of enterprises in major world economies[1] for June and July allows us to assess how, consequently to the collapse registered in the spring months, there was a clear recovery in world trade during summer. After having recorded a fall close to 30% between the end of 2019 and the spring of 2020, world trade recovered by 20% during the summer months, returning to levels that are only 6% lower than last summer. Contrary to what many analysts feared and predicted, the pandemic and the resulting worldwide lockdowns did not translate into a collapse in international trade of the same magnitude as those suffered in 2009 due to the Great Recession. Introducing a conservative hypothesis of relative stability of world trade in the coming months[2], at the end of 2020 world trade in quantity will record a decrease of 8%, significantly lower than the -13% registered in 2019.
The graph below shows the comparison between world trade time series calculated by ExportPlanning and by CPB World Trade Monitor.
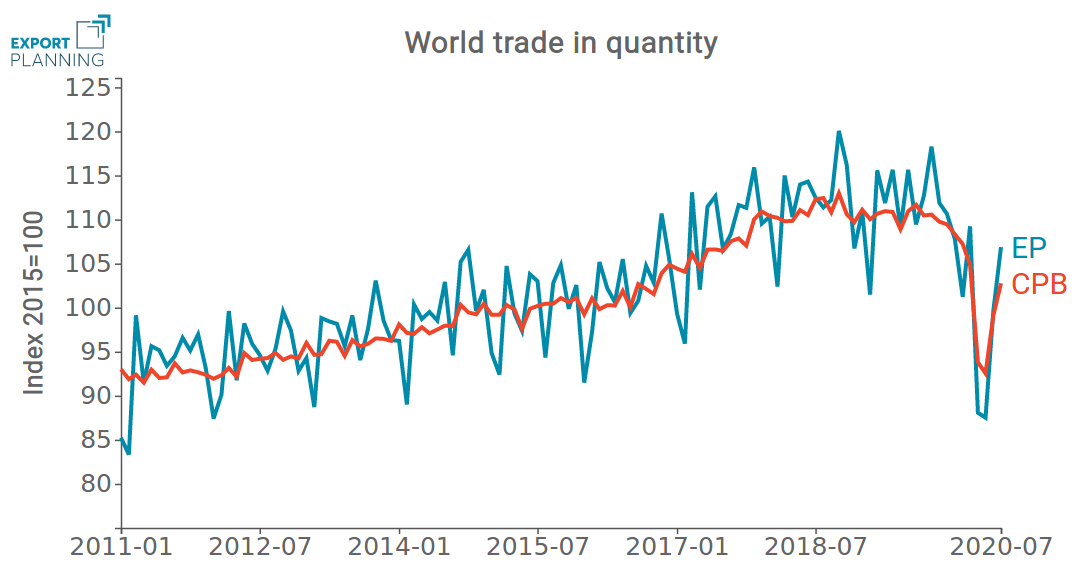
Source: ExportPlanning
Go to World Trade DataMartThe graph shows the collapse suffered by world trade in the first months of the year and the subsequent strong recovery. Also, it is evident the high coherence between the signals obtained from the two sources. If we take into account the strong methodological differences[3] used in the calculation of the two measures, the consistency of the signal detected is a guarantee of the reliability of the results obtained.
In the following map each country shows, through the size of the circle, the variation of its imports between the first seven months of 2020 and the corresponding period of 2019. In this way it is possible to have at a glance an evaluation of the different areas that have contributed the most to the decrease in trade.
2020 (January-July): world imports at constant prices
Source: ExportPlanning
It is evident that the North America and Western Europe areas are characterized by particularly wide red circles. The United States, in particular, registered a decrease of almost 150 billion dollars between the first seven months of 2019 and the corresponding period of 2020[4].
Among Western Europe countries, Germany and the United Kingdom show the most significant contractions, with import declines respectively of 80 and 70 billion dollars.
Conversely, the circles in Asia are relatively small, both for the larger economies (China and Japan) and for South Korea and the ASEAN countries. Imports from Vietnam and Taiwan are increasing.
Conclusions
Contrary to what was feared, world trade this year could reduce at a single digit rate. The greatest contribution to the reduction is attributable to the world's highest income areas, with the most advanced health systems and the greatest resources to turn this health and economic crisis into an opportunity for transformation and development. These considerations lead us to deepen our analysis of the changes taking place in world trade and to be possibilists on the continuation of the development of a world economy that is not only increasingly integrated, but is also able to contain the negative effects on income distribution that have characterized Globalization in the first 20 years of this century.
[1] The ExportPlanning Information System uses nowcasting methodologies to estimate the data of the countries that do not present customs declarations. In this way, it is possible to construct time series related to the declarations of a large sample of countries, keeping the perimeter of the considered countries unchanged. These historical series are calculated both at current prices and at constant prices, using the average unit values recorded at the level of each trade flow: product, reporting country and partner country.
[2] Historically, world trade has always increased between the fourth and third quarter of each year. Of course, the assumption of stable world trade in the coming months is statistically prudent in the absence of new lockdowns.
[3]
The main methodological differences between the two calculation procedures are:
[4] In order to be able to calculate this measure for all countries in the world, it has been calculated as the sum of the exports declared by the partner countries, using the mirror flow technique. This technique makes it possible not only to calculate a measure for all countries in the world, even if they do not present customs declarations, but also to have particularly robust results, because it minimizes the effects due to possible detection errors in the declarations of specific countries.
You may be interested in:

World Trade in Capital Goods: Preliminary Results for 2025 and Forecasts for 2026-2029
Published by Marcello Antonioni. .
Metal industry Global demand Forecast Uncertainty International marketingAfter a positive performance in 2025, a widespread deterioration is expected for next year [ Read all ]

Between uncertainty and diversification: the map of demand in the first nine months of 2025
Published by Marzia Moccia. .
Conjuncture Global demand Global economic trendsBetween uncertainty and diversification: the map of demand in the first nine months of 2025 [ Read all ]

The Barometer of World Trade: What the First Nine Months Tell Us
Published by Simone Zambelli. .
Exchange rate Conjuncture Global demand Uncertainty Global economic trendsThe Barometer of World Trade: What the First Nine Months Tell Us [ Read all ]