A review of US Foreign Trade during 2021
US goods trade deficit hits 1.1 trillion dollars as imports went through a significant increase across 2021
Published by Lorenzo Fontanelli. .
Conjuncture United States of America Trade balance Global economic trendsThe availability of ExportPlanning pre-estimates on US foreign trade flows, accessible through our US trade database, make it possible to describe the current status of US exports and imports.
The graph below shows the annual trend of American imports and exports.
Fig. 1: US Foreign Trade (2011-2021)
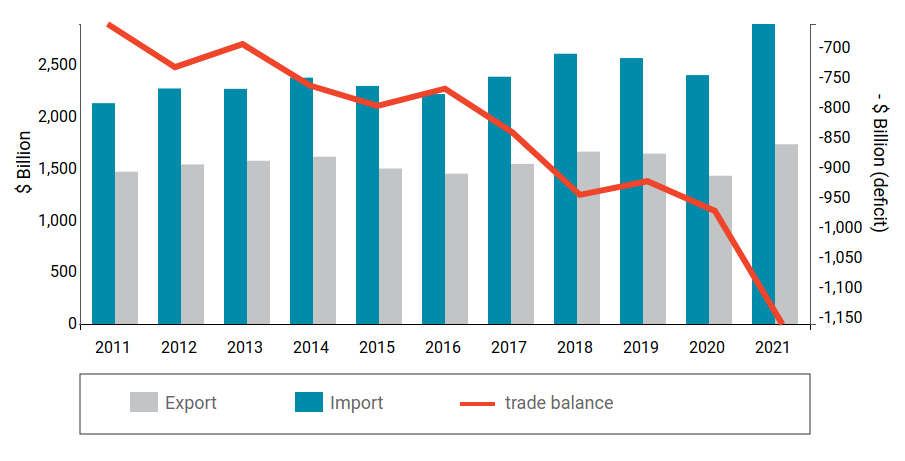
Source: ExportPlanning
It is evident that the deficit in the trade balance of US goods has reached the highest value of the last ten years, equal to 1.1 trillion dollars. The result must depend on the large growth in goods' demand, which saw a vigorous expansion in all quarters of 2021, against overall exports that reach a much lower value, equal to 1.7 trillion.
The increase in the two halves of the year involved not only the first months of the year, but also the second half of the year, a period in which purchases from abroad by the United States showed significant rates of expansion when compared to pre-crisis values.
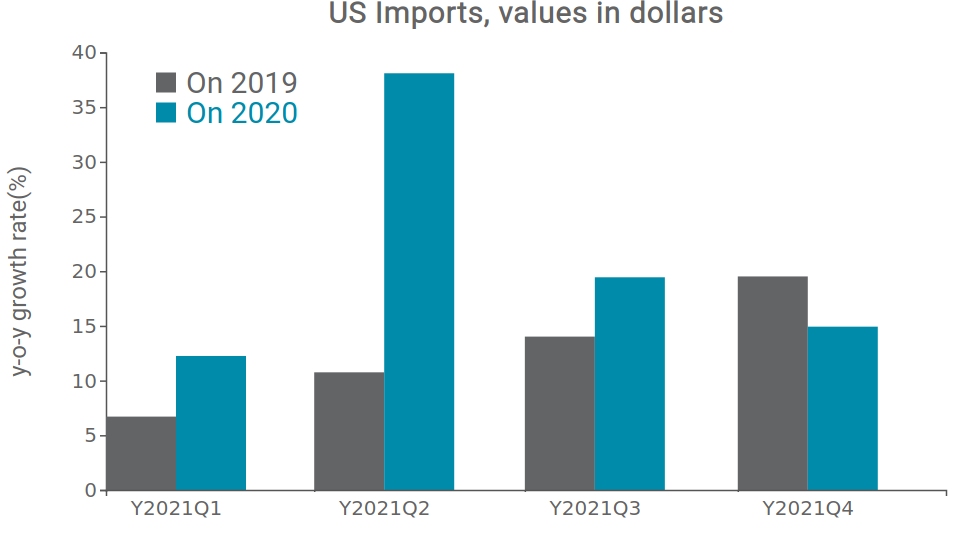
Source: ExportPlanning
As regards exports, however, it is estimated that flows have grown, in 2021, by + 21% compared to 2020 and by + 5% compared to 2019. Over the third and fourth quarters, they show more moderate growth rates compared to imports.
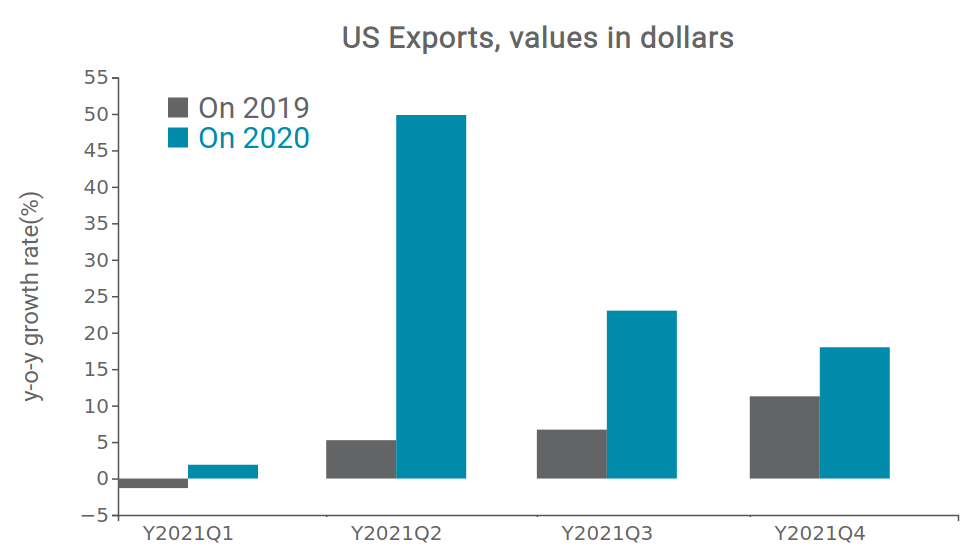
Source: ExportPlanning
But for which industries is the US trade balance recording the highest deficit?
In the following graph, the different sectors are positioned on the basis of imports (x-axis) and exports (y-axis) recorded in 2021. In this way it is possible to have an idea of which ones are facing the largest deficit in the trade balance, placed below the bisector.
Source: Elaborations on ExportPlanning data
The sectors with the most significant deficit include communications equipment (F1.42), computers and peripheral units (F1.41) and their related supply chain (D1.12) as well as cars, buses and caravans (F3.11) and the pharmaceuticals sector (E4.11, -70 billion dollars) .
In deficit, although more contained, specific sectors belonging to the Home and Fashion System, such as outerwear (E2.13), jewelery and costume jewelery (E2. 71), household appliances (E3.25), furniture and other furnishing elements (E3.22), and footwear (E2.22). On the vehicle components front, the parts and accessories for non-electric vehicles (D1.12) and the motors and generators for electric vehicles ( D4.11), while aircraft components (D3.32) go against the trend, which, together with precious metals (A2.16) and petroleum products (A2 .21), shows a positive balance in trade.
Looking instead at the main trading partners of the United States, the data indicate a significant trade deficit towards some European countries, first of all Germany (-73 billion dollars), followed by Italy (-40 billion), France (-21 billion) and Spain (-3 billion), while there was a balance of 4 billion in trade with Great Britain. As for the Asian markets, it is important to mention the increased deficit towards some strategic partners in the region, such as Japan , South Korea , and Taiwan.
However, it is the bilateral deficit with China that is of greatest concern: in 2021, it amounted to -380 billion dollars. This result is also partly the result of China's failure to comply with the commitments agreed in the Phase One Deal , signed at the beginning of 2020.
The relaxation of commercial relations with the Country of the Dragon could therefore still be far away.
You may be interested in:

Healthcare Industry: Robust Growth in international trade confirmed in 2025
Published by Marcello Antonioni. .
Health products Conjuncture Export Global economic trendsWorld exports of the healthcare industry have been growing strongly, across almost all sectors, but with differences between competing countries [ Read all ]

Electrical Engineering: one of the fastest-growing industrie in international trade 2025
Published by Marcello Antonioni. .
Electronics Conjuncture Export Global economic trendsWorld exports of Electrical Engineering are growing robustly, across almost all sectors, but with differences between competitor countries [ Read all ]

US Tariffs: Even More Uncertainty?
Published by Marzia Moccia. .
United States of America Uncertainty Trade war Global economic trends“Tariff is the most beautiful word in the dictionary”, stated Donald Trump during his second campaign for the White House, clearly foreshadowing the central role that tariffs would play in shaping t}... [ Read all ]