Price Rise in 2021: some Evidence from World Trade Data
World trade data provide an initial proxy for the change in average prices recorded along the major manufactured goods supply chains
Published by Marzia Moccia. .
Industries Conjuncture Covid-19 Global economic trends
It is now well known that 2021 can be described as "the year of recovery"; recovery that in timing and intensity was far greater than expected.
In fact, based on information accessible through the Annual international trade database, it is documented that as of final 2021, global trade in goods showed growth - in dollars - of 28% compared to 2020 and 18% compared to the pre-pandemic period (Fig.1).
Fig. 1 – World trade dynamics
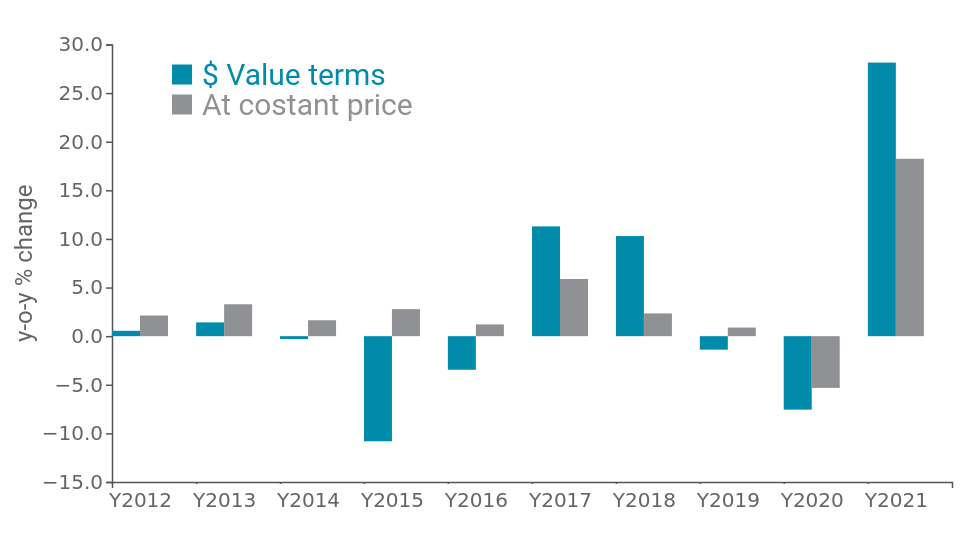
Source: ExportPlanning - Ulisse Datamart
The result was, in part, also supported by the sharp rises in prices that occurred during the year, affecting commodities in particular, reflecting generalized and particularly intense price increases for the energy, metals (ferrous and nonferrous) and plastics households.
When measured at constant prices, net of price changes and exchange rate fluctuations, world trade in fact increased in quantity by 18 % over 2020, for a change in average world export and import prices of about 10% over the year.
Against this backdrop, it is therefore particularly informative to break down the change in average prices recorded along the major manufactured goods supply chains, as a first proxy, albeit an aggregate and only indicative one, of the pass-through effect of price increases from upstream to downstream in the supply chain.
The following graph positions more than 200 sectors in relation to the average change in prices per sector recorded in 2021 compared to last year (x-axis) and compared to pre-crisis levels (y-axis). Based on this representation, four distinct areas can be identified in the graph area: in the upper right are those sectors that have experienced a large price increase over the past year, placing themselves stably above pre-crisis price levels; in the lower right, on the other hand, it is possible to identify those sectors that have indeed shown price growth, but are characterized by a price level relatively in line with 2019; in parallel, in the upper left area, it is possible to trace the sectors whose most significant increases were experienced during 2020, now standing at levels far above pre-crisis levels, albeit with a relatively modest change experienced during 2021.
Fig.2 – Change in prices by sector
Source: ExportPlanning - Ulisse Datamart
First, it is possible to show that most of the analysis sectors experience an increase in the average reference price compared to 2019, but of rather varying intensity.
As expected, almost all of the Commodities are positioned in the upper right area, reflecting the significant bullish phase that is affecting the various commodities.
In contrast, the more downstream sectors, such as Consumer Goods and Investment Goods, witness significantly smaller price changes during 2021. These include particular categories of goods, for which international demand has experienced a rapid increase since the second half of 2020. These are sectors driven by the consumption preferences of the "new normal", such as Household Appliances, Bicycles, and Furniture, which end 2021 with an average reference price largely higher than pre-crisis.
More differentiated appears to be the situation for Intermediate Goods: registering the most significant increases are mainly the construction, chemical intermediates and batteries and accumulators segments.
You may be interested in:

European export trends: instability and divergences at the end of 2024
Published by Simone Zambelli. .
Slowdown Export Europe Conjuncture Global economic trendsDespite mild signs of recovery, european exports remain weak and fragmented [ Read all ]
Mechanical Engineering: 2024 Preliminary Results of World Exports
Published by Marcello Antonioni. .
Check performance Export Metal industry Uncertainty Conjuncture Global economic trendsAn overall 2024 result in moderate growth for world exports of Mechanical Engineering, but with significant sectoral differences [ Read all ]

World Exports of Machinery: Preliminary Results for 2024
Published by Marcello Antonioni. .
Industrial equipment Uncertainty Export Conjuncture Global economic trendsPositive 2024 performances for most sectors within the Machinery industry, but with (very) differentiated intensity [ Read all ]