The outlook for the US market: US imports between uncertainty and dollar appreciation
U.S. imports have been growing markedly over the past few quarters, however early signs of slowdown emerge
Published by Giulio Corazza. .
Slowdown Exchange rate Conjuncture Global economic trends
Supported also by bullish price dynamics, in 2021 U.S. imports reached the level of $2.849 trillion, an increase of more than 14 percent over pre-crisis values (2019). In euros, this threshold is equivalent to 2,412 billion, undoubtedly marking a record high.
Moreover, the availability of information on the first nine months of the new year, published in ExportPlanning in the U.S. Conjuncture datamart, makes it possible to document how the growth in demand for U.S. foreign goods continued to show largely positive results in the first nine months of the new year: in fact, in the January-September period the country's imports registered an overall increase of +22 percent compared to the corresponding period of 2021, placing them along the trend of sustained increases that have characterized the last few quarters (Fig.1).
Fig.1 – U.S. demand measured in current dollars and euros
(trend change)
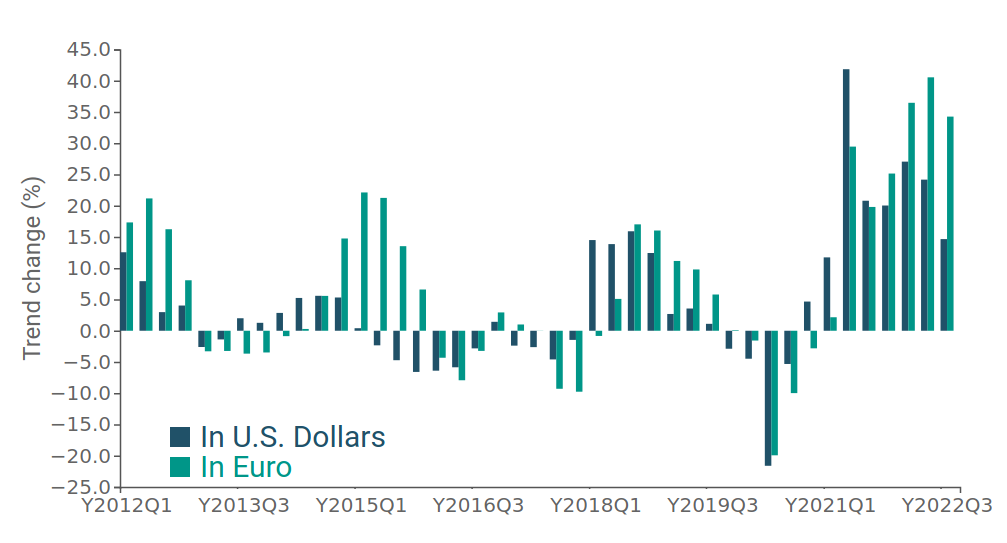
Source: ExportPlanning Processing
While the U.S. appears to have closed out 2021 with a large recovery of what was lost with the pandemic outbreak, thanks to a decisive recovery of the U.S. economy, it is evident that the results for the third quarter of 2022 seem to intercept a slight retrenchment in the pace of expansion, which nevertheless remains at broadly positive levels: against a Q1 and Q2 dollar growth rate of close to +25 percent, the third quarter stands at +15 percent.
However, the reading of this figure is not so obvious. Indeed, a first factor to take into account is the evolution of the euro/dollar exchange rate ratios over the past few months. In fact, as can be seen from Fig.1, the dynamics of U.S. imports in the last quarter appear much higher when measured in euros, due to the large appreciation that has characterized the U.S. currency over the past few months. Indeed, since last fall, the euro/dollar exchange rate has been in a bearish phase in the face of the prospects of normalization of U.S. monetary policy relative to a still accommodative stance of the European Central Bank. This dynamic accelerated significantly from the spring of this year until this summer, when the euro fell below parity and remained steadily below its historical average of 1.2.
Fig.2 – Euro/dollar exchange rate dynamics
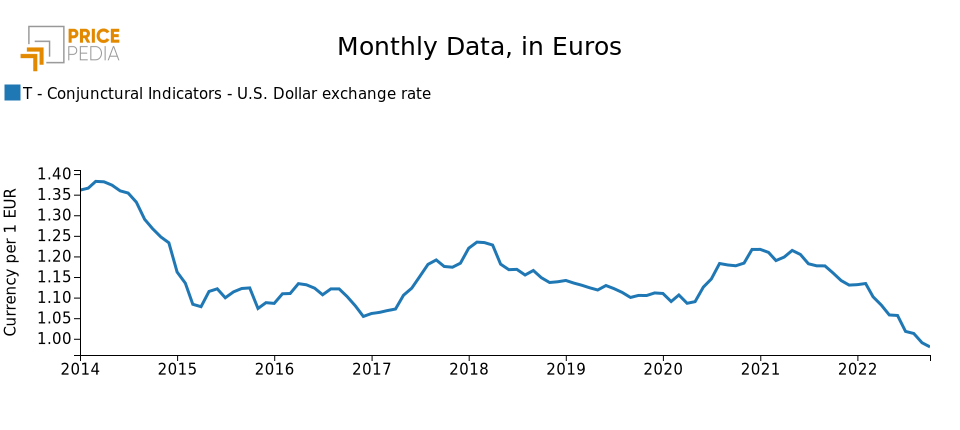
Source: PricePedia
Recent interest rate hikes by the U.S. central bank, the war in Ukraine and the rush for safe-haven currencies have thus led the dollar to appreciate sharply, both against the euro and against other currencies. This seems particularly relevant for a country exporting to the U.S. market, as a stronger dollar allows the United States greater purchasing power. This fact is also corroborated by the country's energy independence.
Tuttavia, a fronte della crescente incertezza internazionale e della necessità di fronteggiare la forte inflazione sul mercato USA, nel corso degli ultimi mesi è peggiroato l’outlook economico del paese per il prossimo biennio, con il profilarsi di una congiuntura al ribasso certificata dall’ultima pubblicazione del World Economic Outlook e di un PMI manifatturiero al di sotto della soglia dei 50.
Fig.3 – Growth rate U.S. Gross Domestic Product (constant prices)
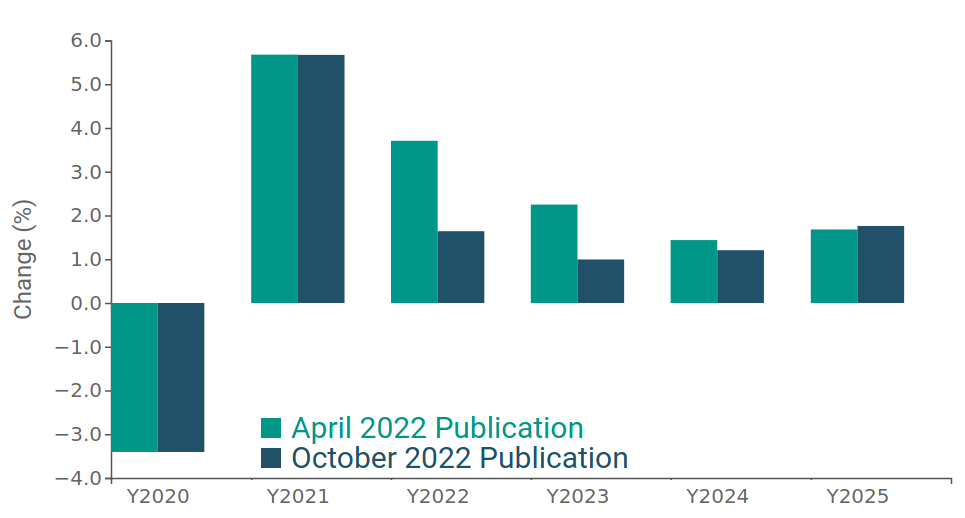
Source: ExportPlanning elaborations on IMF data
A breakdown by industry
Within this framework, it may be useful to analyze which industries are characterized by a demand for goods that is still holding up, as opposed to those that, due to the various factors analyzed above, seem to have instead scaled back their pace of development.
The following graph shows U.S. imports broken down by industry, comparing the trend rate of change in the third quarter with that for the first half of the year; the size of the spheres is proportional to the import values, and is thus a measure of the importance of the different industries. This representation thus makes it possible to identify to the left of the bisector those industries that are accelerating, to the right those that are decelerating.
Fig.4 – U.S. imports by industry
By hovering the mouse over the circle that identifies an industry, a table summarizing the data for the selected industry can be displayed
Source: ExportPlanning Processing
The graph shows that the investment goods cluster is the one where demand has held up the most, particularly for Transportation and Agriculture and ICT Tools and Equipment. Signs of deceleration emerge, however, especially in the case of Instrumental Mechanics and Plants, as documented in the article The slowdown in U.S. demand for Machinery.
Rather diversified, on the other hand, is the situation for consumer goods: the industries of finished household products and personal goods remain dynamic (aided by the results of the clothing segment), while the Agribusiness sector remains stable. On the other hand, health care products appear to be slowing down markedly, probably heading toward a normalization of the particularly dynamic pace of growth in the last two years.
Demand for industrial raw materials is also decelerating, a result attributable mainly to the appreciation of the dollar in recent months.
You may be interested in:

European export trends: instability and divergences at the end of 2024
Published by Simone Zambelli. .
Slowdown Export Europe Conjuncture Global economic trendsDespite mild signs of recovery, european exports remain weak and fragmented [ Read all ]
Mechanical Engineering: 2024 Preliminary Results of World Exports
Published by Marcello Antonioni. .
Check performance Export Metal industry Uncertainty Conjuncture Global economic trendsAn overall 2024 result in moderate growth for world exports of Mechanical Engineering, but with significant sectoral differences [ Read all ]

World Exports of Machinery: Preliminary Results for 2024
Published by Marcello Antonioni. .
Industrial equipment Uncertainty Export Conjuncture Global economic trendsPositive 2024 performances for most sectors within the Machinery industry, but with (very) differentiated intensity [ Read all ]