American imports pull the brakes
A geographic and sectoral overview
Published by Alba Di Rosa. .
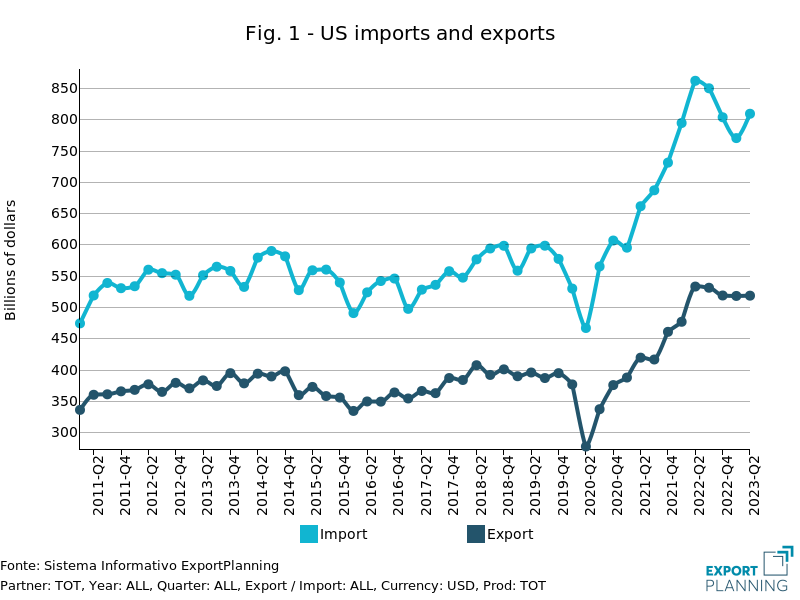
Export Asia Europe Trade war Conjuncture Slowdown United States of America Foreign markets Foreign market analysisU.S. foreign trade is beginning to show signs of contraction, albeit unevenly at both sectoral and geographic level. This is what emerges from the recent update of the U.S. quarterly trade database, available in the Analytics section of ExportPlanning, and which provides an estimate of the dynamics of U.S. trade flows across borders in Q2-2023.
Specifically, U.S. imports in current dollars dropped by 6 percent in the second quarter of the current year, compared to the same period of 2022, while exports fell by 2.7 percent. These contractions form part of the framework of general slowdown for trade growth rates, that had already emerged in previous quarters, and which brought exports into negative territory in Q2-2023; for imports, on the other hand, the first quarter of the year had already marked a 3 percent year-on-year drop.

Looking more closely at the data on U.S. imports, broken down to product groups, we can distinguish the different sectors into three clusters in terms of performance.
- As can be seen from the chart below, the outlier in positive territory is automotive and agricultural equipment, whose US imports experienced a YoY (year-on-year) growth in current dollars of more than 20% in Q4-2022, and accelerated the pace in H1-2023 (+35.6%).
- A wider number of sectors, on the other hand, show more modest growth in the first half of 2023, and generally lower than Q4-2022: among consumer goods, we can find the case of pharmaceuticals and medical products (+4.8% in H1), as well as food and beverages; among intermediate goods, components for transport equipment showed a 7% increase in the first 6 months of 2023; among capital goods, we can find the cases of electrotechnical products and industrial plants1, which halved their YoY growth rates in the first half of 2023, compared to those recorded in Q4-2022, while remaining nonetheless in positive territory.
- For several commodity groups, U.S. imports fell in H1-2023, notably raw materials and some consumer goods. The slowdown in finished personal and household goods (in both cases around -20% in H1) is notable, and resulted as more pronounced than in Q4-2022; the same goes for the ICT tools and equipment sector (-10.3%). Demand for natural and industrial raw materials (around -15%), industrial tools and equipment (-2.5%) and several intermediate goods segments also declined in the first half of the year.
Fig. 2 - Performance of U.S. imports, by sector
By hovering the mouse over the circle that identifies an industry, you can see a table that summarizes data on the growth rates represented in the graph and U.S. imports in H1-2023.
Source: ExportPlanning - US Quarterly Trade Database
Partner country focus: the cases of EU and China
Let us now look at the dynamics of U.S. trade with major partner countries, starting with China, the main subject of tensions in recent years.
As can be seen from the chart below, which shows the YoY rate of change in U.S.-China trade, in Q2-2023 U.S. imports from its Asian partner fell by 20%, following a 29% decline in Q1 and a 17% drop in Q4-2022.

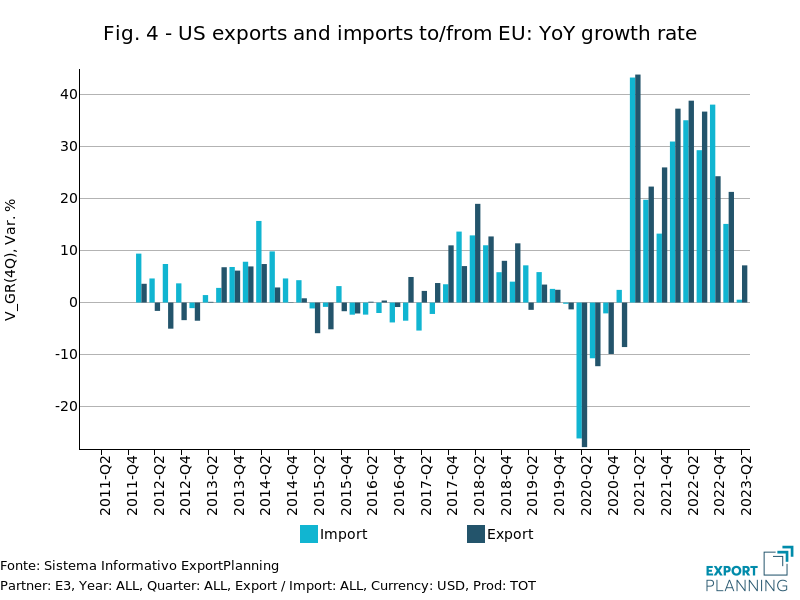
More positive, however, is the situation on the EU front: indeed, U.S.-European flows remain in positive territory, in spite of a slowdown for growth rates. Compared to the double-digit growth rates recorded since the second half of 2021, for Q2-2023 ExportPlanning estimates, based on U.S. Census Bureau data, a 7% increase for U.S. exports to the EU, and a substantial stability (+0.6%) for imports.

A look at geopolitics
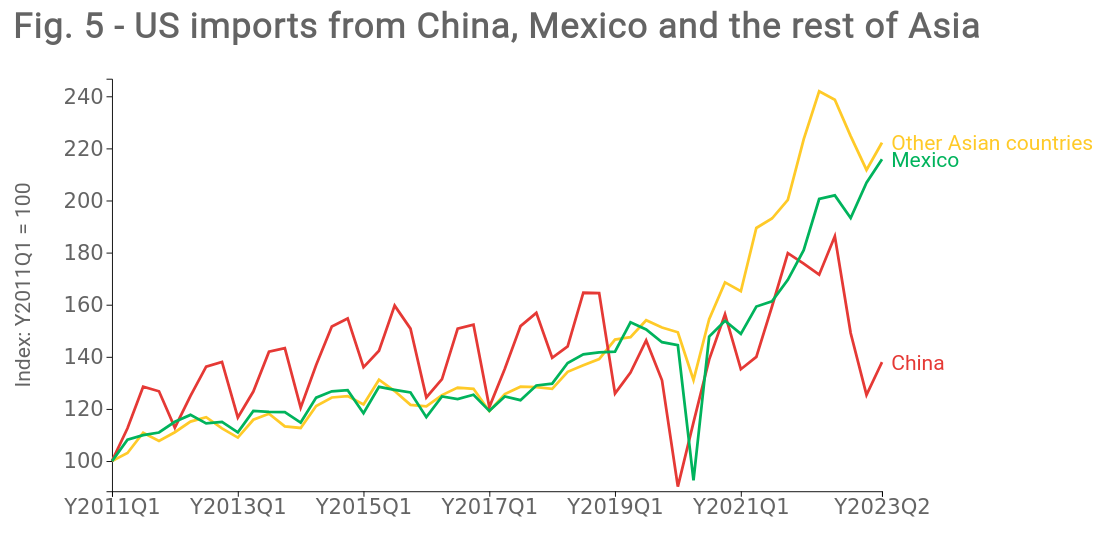
The foreign trade numbers just described set against a geopolitical backdrop that remains tense on the U.S.-China front, and which is resulting in a gradual shift of U.S. supplies to Asian low-cost, trade war tariff-free alternatives; hand in hand, reshoring to the mainland also keeps going.
This is clear from data on U.S. imports from Mexico and the rest of Asia, which, contrary to the performance of demand from China, have shown an upward trend in recent quarters.

Source: ExportPlanning - US Quarterly Trade Database
Thus, foreign trade data don't show signs of an easing of the trade war, although some attempts to normalize the relationship between the two countries have emerged. Consider, for example, Treasury Secretary Janet Yellen's trip to China a few days ago, which followed Secretary of State Antony Blinken's trip in June. While there have been improvements on the communication front between the two countries, however, the trade conflict still seems far from resolved: it was only days before Yellen's visit, for example, that the Chinese Ministry of Commerce announced the introduction of export restrictions on gallium and germanium, critical materials in semiconductor manufacturing.
World Container Index: freight rates numbers
Last but not least, a useful indicator to go along with the analysis of foreign trade numbers is the World Container Index: this is an index that provides weekly freight assessments of 40-foot containers, by specific route, and thus tends to be correlated with the dynamics of international trade.
Specifically, the chart below shows the specific indexes for different routes: we look at the Rotterdam-New York and Shanghai-Los Angeles indexes.

Source: PricePedia on Drewry data
As can be seen from the graph, the Shanghai-Los Angeles index shows a slowdown from the second half of 2022 and a gradual return, starting in 2023, to pre-Covid levels. In contrast, the Rotterdam-New York index, although showing more resilience in the second half of last year, has displayed a gradual slump since the beginning of 2023, which seems to have become more pronounced in recent weeks.
This dynamics thus seems to mirror that of trade measured in U.S. dollars, which, in the case of EU flows to the U.S. (Rotterdam-New York), showed greater resilience between late 2022 and early 2023 than EU flows to China (see Rotterdam-Shanghai index), and Chinese flows to the U.S. (Shanghai-Los Angeles). The "normalization" of freight rates also for the Rotterdam-New York route thus suggests, even for EU exports to the U.S., the onset of a phase of slowing demand, as the inevitable combined effect of an economic environment marked by inflation and restrictive monetary policies.
1. For a focus on the sector, please see the article "US Capital Goods Demand: the figures of H1-2023".


