Food & Beverage: which American States have the greatest potential?
United States 1st world market for total imports and premium-price segments. Texas, Florida and Illinois at the top of the ranking
Published by Marcello Antonioni. .
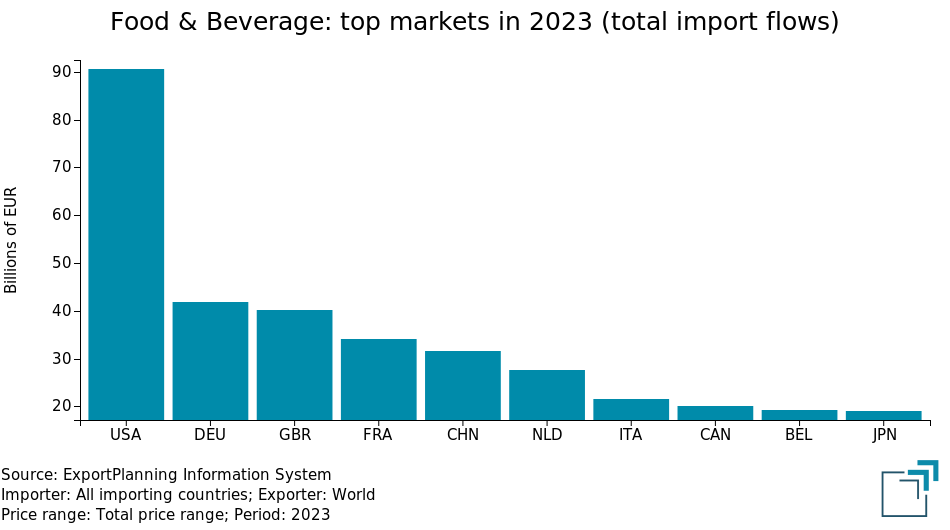
United States of America Food&Beverage Marketselection International marketing American States International marketingThe 2023 data at world trade level, available in the ExportPlanning Information System, allow to document the centrality of the US market for global exports of Food & Beverage: with almost 91 billion euros (equal to 13.2 percent of the total), last year the USA represented by far the main destination for global sales in the industry1.

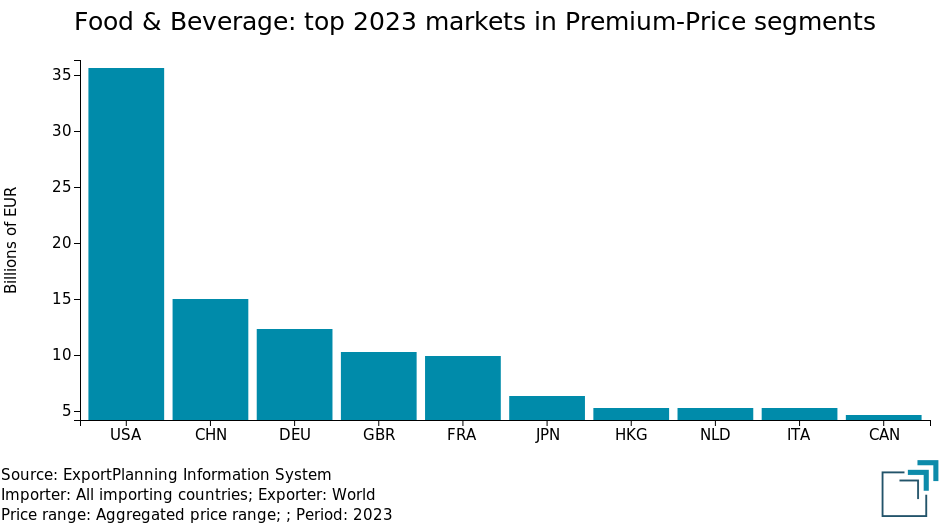
Moreover, with around 36 billion euros (18.6 percent of the total), in 2023 the United States was largely the first market for Food & Beverage in the premium price segments, i.e. imports on the high and medium/high price ranges.

USA by far the 1st global Food & Beverage market (total flows and premium segments). Which States is it useful to focus on?
The application of the analysis model of the ExportPlanning Market Selection tool to trade data abroad available at the level of American States can allow to build a ranking of market potential for Food & Beverage exports.
In particular, for the purposes of this analysis, the following potential indicators were considered for the "E0-packaged food and beverage" macro-sector of the ExportPlanning classification and for each American State:- value of imports 2023: indicates the relevance of the market;
- change in imports in the period 2020-2023 in value: indicates the growth capacity (measured in absolute terms) of the market;
- change in imports in the period 2020-2023 as a percentage: indicates the growth capacity (measured in relative terms) of the market.
In the analysis process of the Market Selection model, the aforementioned indicators were normalized, on a scale of 0-100, in order to contribute to the calculation of a synthetic indicator of potential2.
The application of the Market Selection model
to the trade data of the American States
highlights Texas, Florida and Illinois
at the top of the ranking for Food & Beverage exports
The table below highlights the main American States in terms of levels of potential for Food & Beverage exports, with the values recorded by each state for the different indicators considered in the Market Selection.
Export of packaged food and beverage:
ranking of potential at the level of American States
| Potential Index | Imports 2023 | Delta Imports 2023/2019 | CAGR Imports 2023/2019 | |
| State | (0-100) | (Bn $) | (Mn $) | (% in $) |
| Texas | 95.2 | 9.2 | +3 828 | +14.4 |
|---|---|---|---|---|
| Florida | 92.0 | 7.1 | +2 492 | +11.5 |
| Illinois | 91.6 | 10.9 | +3 569 | +10.5 |
| New Jersey | 88.8 | 13.4 | +3 700 | + 8.4 |
| Pennsylvania | 87.3 | 4.0 | +1 483 | +12.3 |
| California | 85.0 | 14.7 | +2 909 | + 5.7 |
| New York | 79.7 | 7.5 | +1 104 | + 4.1 |
| Indiana | 74.4 | 1.6 | + 708 | +16.0 |
| Maryland | 74.1 | 1.8 | + 717 | +13.1 |
Source: ExportPlanning processing on US Census Bureau data
Food & Beverage Exports: ranking of potential for American States
1. Texas
The Texas market, in fourth place overall in terms of the value of Food & Beverage imports in 2023 (with 9.2 billion dollars), was characterized by a very lively growth rate in the period 2020- 2023: overall +3.8 billion dollars, for an average annual growth rate (CAGR: Compound Annual Growth Rate) of +14.4%.
Mexico (2023 share of 48.3%) is by far the main partner country in the market, ahead of Canada (10%), Singapore (9.5%) and Italy (4.1%), first European partner in the ranking, ahead of France (3.6%).
2. Florida
The Florida market is positioned, however, in sixth place overall in terms of the value of Food & Beverage imports in 2023 (with 7.1 billion dollars). The period 2020-2023 was characterized by a very rapid growth rate: CAGR of +11.5%, for an overall increase of approximately 2.5 billion dollars.
In the 2023 ranking of the main market partner countries, Mexico stands out above all (with a 16 percent share), preceding France (10.4%), Canada (8.4%), Brazil (7.7%) and Italy (6.5%).
3. Illinois
The Illinois market, in third place overall in terms of the value of Food & Beverage imports in 2023 (with 10.9 billion dollars), was characterized by a 2020-2023 CAGR of +10.5% , for an overall increase of 3.6 billion dollars.
The 2023 ranking of the main partner countries of the market sees Mexico clearly in first place (with a share of 58.6 percent), preceding - in order - Canada (21.8%), Italy (2.9%) and France (1.9%).
4. New Jersey
The New Jersey market, in second place overall in terms of value of Food & Beverage imports in 2023 (with 13.4 billion dollars), was characterized in the period 2020-2023 by an overall increase of 3.7 billion dollars (CAGR of +8.4%).
In the 2023 ranking of the main partner countries on the market, Mexico and Italy compete for leadership (with shares of 14.1 and 13.5 percent respectively), ahead of < b>Canada (8.2%), France (6.2%) and Spain (4.8%).
5. Pennsylvania
The Pennsylvania market, in eighth place in terms of value of Food & Beverage imports in 2023 (with 4 billion dollars), was characterized by a particularly lively growth rate in the period 2020- 2023: overall +1.5 billion dollars, for a CAGR of +12.3%.
Canada (2023 share of 36.2%) is by far the main partner country on the market, preceding Mexico (13.6%), Italy (7.2%), Ireland (5.2%), Turkey (3.7% ) and Germany (3.6%).
6. California
The California market, in first place overall for the value of Food & Beverage imports in 2023 (with 14.7 billion dollars), was characterized by a 2020-2023 CAGR close to 6 percentage points , for an overall increase of approximately 2.9 billion dollars.
The 2023 ranking of the main partner countries of the market sees Mexico and Canada clearly in first places (with shares of 14.9 and 12 percent respectively), preceding - in the order - Thailand (8.6%), Italy (6.8%), France (5.9%) and China (5.7%).
7. New York
The New York State market, in fifth place overall in terms of value of Food & Beverage imports in 2023 (with 7.5 billion dollars), was characterized in the period 2020-2023 by an increase total of 1.1 billion dollars (CAGR of +4.1%).
In the 2023 ranking of the main partner countries on the market, France is the leader (with a share of 21 percent), ahead of Canada (14.7%), Italy (12.5%) and Mexico (6.2%).
1) In particular, the United States is the first destination for world exports in 2023 in the following sectors of packaged food and beverage:
- Oil, condiments and spices
- Rice, pasta and flour (packaged)
- Meat and fish (processed and packaged)
- Vegetables and fruit (processed and packaged)
- Cookies and other bakery goods
- Sugar, chocolate, sweets and ice cream
- Tea and coffee (packaged)
- Water and soft drinks
- Alcoholic beverages.
2) The index of potential was calculated as the weighted average of the scores associated with the indicators considered, with the following weighting scheme:
- value of imports 2023: 50%;
- change in imports in the period 2020-2023 in value: 30%;
- change in imports in the period 2020-2023 in percentage: 20%.


