U.S. vs. China: dynamics and economic trends in demand for foreign products
Published by Marzia Moccia. .
United States of America Asia Conjuncture Global economic trends
In the previous article The differentiated profile of recovery: a geographical analysis, we documented how the initial signs of cyclical recovery in global trade are driven by the dynamics of the United States and China, in contrast to a more struggling Europe.
However, the relative sectoral dispersion of cyclical dynamics allows us to document how, even for these two “giants” of the world economy, the profile of the recovery is following a differentiated pattern.
First of all, from a medium-term perspective, the import dynamics of the two countries in the 2022-2023 biennium have been different: on the one hand, 2022 was a year of solid growth for American imports (in line with EU growth), while on the other hand, the difficulties faced by China due to the resurgence of the SARS-CoV-2 virus and the related measures implemented by Beijing were evident. As shown in Fig.1, the downturn in Chinese imports has been visible since 2022, lasting through the first three quarters of 2023. The return to positive territory has only occurred in the most recent quarters, marking a trend reversal that aligns the Dragon Nation with the United States.
Fig.1 - Dynamics of Imports at Constant Prices: United States vs China vs Europe
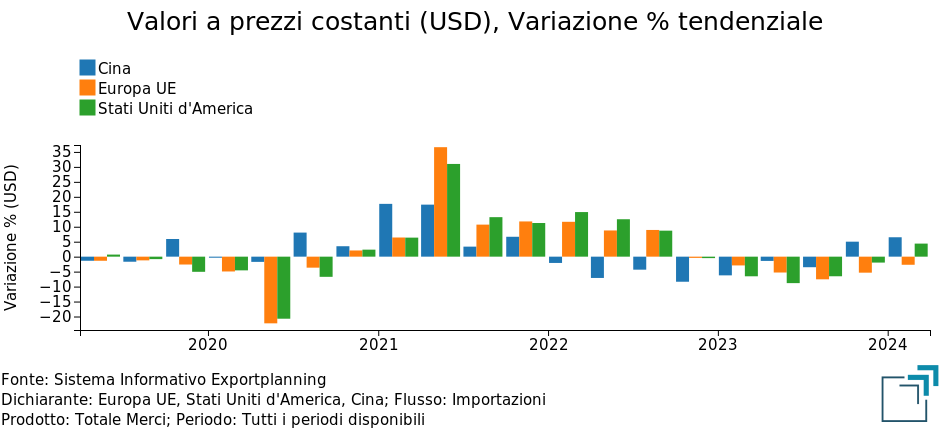
Source: ExportPlanning
These results imply further differentiations when broken down by sector.
The following bubble map shows the main industries constituting the demand for foreign products in the two countries, positioning them based on the constant price growth rates1 recorded in 2023 (X-axis) and in the first quarter of 2024 (Y-axis).
The yellow bisector allows the identification of two distinct areas: above it, the sectors experiencing a gradual recovery compared to the average trend in 2023, and below it, those intensifying their slowdown.
Fig.2 - USA: import map by industry at constant prices
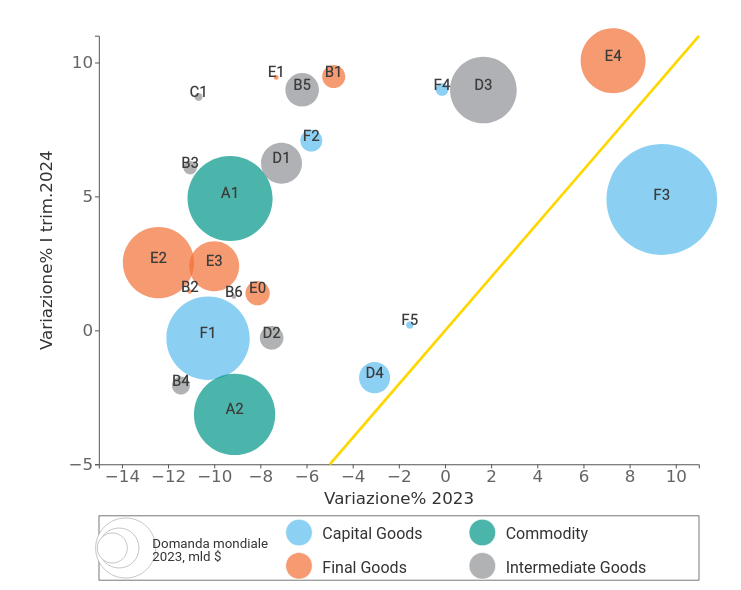
Source: ExportPlanning
The interesting aspect of the progressive rebound in American imports is that it is affecting both the Intermediate Goods component, highlighting the recovery of the local manufacturing industry, and various segments of Consumer Goods, which were heavily penalized throughout 2023. Examples include the Fashion System (E2), Home System (E3), Packaged Food (E0), and Fresh Food (B1).
Particularly noteworthy is the performance of Machinery imports (F4), which began 2024 with strong growth after ending 2023 on a stable note.
The context is different for the Chinese market, where the cyclical rebound is closely tied to the recovery in demand for Intermediate Goods and Commodities. Imports of Consumer Goods remain in negative territory, with some cases showing a further slowdown compared to the 2023 trend: this is the case for imports of the Fashion System (E2) and Packaged and Fresh Food (E0 and B1). However, as with the United States, positive signals are also evident for the Machinery segment (F4) in China.
Fig.3 - China: import map by industry at constant prices
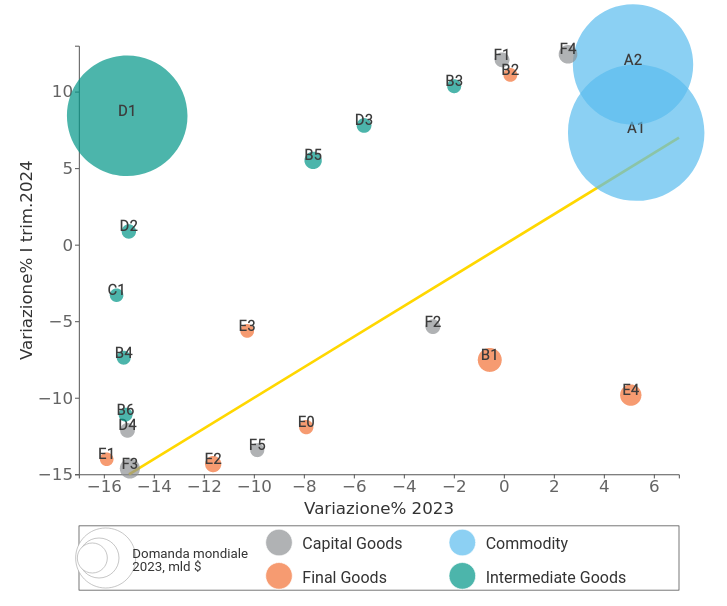
Source: ExportPlanning
The persistent difficulties in Chinese consumer goods, however, do not influence the overall result, due to the low weight of these segments in the total imports of the Dragon Nation. Raw materials alone account for over 50% of total Chinese imports, with an additional 20% represented by Intermediate Goods; foreign demand for Investment and Consumer Goods represents less than 10% each.
In contrast, the distribution of American demand appears less polarized, with Investment and Consumer Goods each accounting for about 30%.
The cases of the United States and China thus highlight a recovery picture that is still uneven, compounded by the "structural" characteristics of the economies being analyzed.
In this sense, the role of information is more necessary than ever, in order to segment the major ongoing phenomena by sector and country, and thereby optimally allocate resources.
ExportPlanning's mission is precisely to accompany businesses and consultants in the phases of strategic planning for foreign markets, transforming secondary data into useful information for business decision-makers, in an uncertain and changing context.

1) Imports are measured at constant prices, in order to provide a reading of real dynamics, net of price changes.
You may be interested in:

The United States and the balance of payments: a fragile balance
Published by Veronica Campostrini. .
Macroeconomic analysis Economic policy Trade balance United States of America Dollar Foreign market analysisThe Dollar as a Safe Haven Asset From 1992 to 2024, the U.S. national debt experienced unprecedented growth. Yet, contrary to what one might expect, inflation remained relatively stable — averaging}... [ Read all ]

The export of Prosecco PDO in light of Trump’s new tariffs
Published by Silvia Brianese. .
Export Importexport Italy Uncertainty Made in Italy United States of America Foreign markets Export markets Foreign market analysisWhich alternative markets for Prosecco PDO following the new U.S. tariff measures [ Read all ]

Trump and the new tariffs of 2025: the list of exempted products
Published by Simone Zambelli. .
United States of America Trade war Trade balance Market AccessibilityTrump and the new tariffs of 2025: the list of exempted products [ Read all ]