World Exports of Mechanical Engineering: Best/Worst International Markets in H1-2024
In the face of declines for China and Russia, the United States is the 1st driving destination. Texas, Georgia and Michigan the most dynamic states
Published by Marcello Antonioni. .
Check performance Metal industry Uncertainty Export markets Conjuncture Industries Global economic trendsMechanical Engineering: best/worst international markets in H1-2024
World trade data for the first half of 2024, available in the ExportPlanning Quarterly World Trade Datamart, allow to analyze the outlook of Mechanical Engineering1 international sales.
.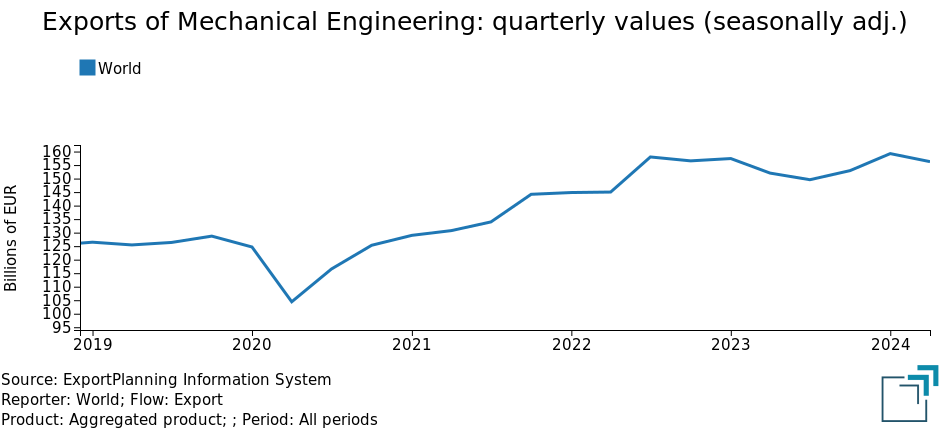
The graph above highlights the uncertainty that has occurred in the last year and a half in global exports of Mechanical Engineering: the levels recorded in the second quarter of 2024 are similar to those of the last quarter of 2022. In essence, the last eighteen months have shown overall stability in global sales of the industry in question.
With reference to the first half of the current year, the balance is of a very weak Year-over-Year growth: +1.6% in euro values; +1.9% at constant prices.
In this context, it is very useful to be able to identify the international markets that are offering the most favorable contributions to the growth of global sales of Mechanical Engineering.
World Exports of Mechanical Engineering:
best/worst international markets in the first semester of 2024
| absolute changes period over period (millions of euros) | |||
| Market | Q1-2024 | Q2-2024 | H1-2024 |
| United States | +1 034 | +1 187 | +2 221 |
|---|---|---|---|
| Brazil | +1 392 | +181 | +1 574 |
| Hong Kong | +294 | +459 | +753 |
| United Arab Emirates | +476 | +184 | +660 |
| India | +311 | +322 | +633 |
| Saudi Arabia | +275 | +281 | +556 |
| Austria | -238 | -135 | -372 |
| France | -445 | - 34 | -479 |
| Russia | -125 | -496 | -939 |
| China | -434 | -504 | -939 |
Source: ExportPlanning processing from Quarterly World Trade Datamart
As documented in the table above, in the first half of the year, in the face of declines in China (-939 million euros compared to the first half of 2023) and Russia (-621 million euros), the United States recorded (with over 2.2 billion euros) the largest increase in terms of sales from the world of Mechanical Engineering.
Following this, there was the trend growth of global exports of the industry to Brazil (+1.6 billion euros), although decelerating in the most recent quarter.
Also noteworthy are the growths - although with trend increases of less than one billion euros - of global sales of Mechanical Engineering to Hong Kong, United Arab Emirates, India and Saudi Arabia.
US market of Mechanical Engineering: main driving States in H1-2024
The data updated to the first half of 2024 of US foreign trade, available at the American State level in the Quarterly Trade of American States Datamart, allow to document the most dynamic geographical areas within the US market, in terms of imports of Mechanical Engineering.
The following table shows the US states that recorded the highest trend increases in the first half of 2024: above all, Texas2 stands out as the main driving state for US imports of Mechanical Engineering (+580 million euros compared to the corresponding half of 2023, accelerating in the most recent quarter).
Behind it, the highest trend increases are recorded for imports from the world of Mechanical Engineering of Georgia3, Michigan4 and Indiana (respectively +477, +376 and +372 million euros compared to the first half of 2023).
US Imports of Mechanical Engineering:
main driving States in the first semester of 2024
| absolute changes period over period (millions of euros) | |||
| American State | Q1-2024 | Q2-2024 | H1-2024 |
| Texas | +213 | +367 | +580 |
|---|---|---|---|
| Georgia | +297 | +179 | +477 |
| Michigan | +277 | + 98 | +376 |
| Indiana | +109 | +263 | +372 |
| Mississippi | + 95 | +237 | +332 |
| Ohio | +109 | +137 | +246 |
| South Carolina | +190 | + 41 | +231 |
| Kentucky | +118 | +111 | +229 |
| North Carolina | +152 | + 60 | +212 |
Source: ExportPlanning processing on Quarterly Trade of American States Datamart
We also note the growth performance of imports from the world of Mechanical Engineering and the like of Mississippi (+332 million euros compared to the first half of 2023, and in clear acceleration in the most recent quarter), Ohio5 (+246 million euros, also improving in the most recent quarter), South Carolina (+231 million euros), Kentucky (+229 million euros) and North Carolina6 (+212 million euros).
Conclusions
The data on international trade in Mechanical Engineering document as in the first half of 2024, within a demand context characterized by an ongoing uncertainty, the US market has by far made the largest contributions to the Y-o-Y growth of global sales, with an increase of over 2.2 billion euros compared to the corresponding half of 2023.
The analysis of the data on US imports of Mechanical Engineering at the State level also allows us to identify some geographical areas (Texas, above all: the most dynamic American market in the first half of the year and the leading importer at the US level in the last 4 quarters) in a phase of significant growth in the first half of 2024.
For exporters of Mechanical Engineering, the possibility of monitoring "in real time" a market of strategic importance (by far the first in the world in terms of value of 2023 imports of Mechanical Engineering [with 94.7 billion euros]7), at the level of State and country of origin, at a sector/business area/product level, can allow you to better support and orient your marketing and commercial strategies.

1) The industry here analyzed includes the following macro-sectors: 2) Texas also ranks first overall for the value of imports from the world of Mechanical Engineering in the last four quarters (with approximately 12 billion euros).
3) Georgia ranks fifth overall for the value of imports from the world of Mechanical Engineering in the last four quarters (with almost 5.3 billion euros).
4) Michigan ranks fourth overall for the value of imports from the world of Mechanical Engineering in the last four quarters (with over 5.3 billion euros).
5) Ohio ranks sixth overall for the value of imports from the world of Mechanical Engineering in the last four quarters (with 4.1 billion euros).
6) North Carolina ranks ninth overall for the value of imports from the world of Mechanical Engineering in the last four quarters (with approximately 3.4 billion euros).
7) It should be noted that China, the second world market for Mechanical Engineering, imported just over 57 billion euros last year.
You may be interested in:

Trump's tariffs on steel and aluminum: an updated overview
Published by Simone Zambelli. .
United States of America Trade war Uncertainty Market AccessibilityTrump's tariffs on steel and aluminum: an updated overview [ Read all ]

Metalworking Machine Tools: Segments with Highest Export Potential
Published by Marcello Antonioni. .
Development stage of Imports Metal industry Industrial equipment International marketing Uncertainty Marketselection Foreign markets Export markets Foreign market analysisIn several segments of the Metalworking Machine Tools there is a significant share of markets in a phase of Growth [ Read all ]

Printing Machinery: how to find the most promising export markets?
Published by Marcello Antonioni. .
Development stage of Imports Metal industry Industrial equipment International marketing Marketselection Conjuncture Export markets Foreign market analysisAn analysis by segments and countries, using the new "Import Development Stage" indicator [ Read all ]