Mixed Signals from the US Market in Q3 2024
Strengthening of dynamics in values, but in a context of retreat of dynamics in quantity
Published by Marcello Antonioni. .
Conjuncture Check performance United States of America Uncertainty Import Global economic trendsThe pre-estimates for the 3rd quarter of 2024, developed by StudiaBo based on US Census Bureau data - and available in ExportPlanning in Quarterly US Trade Datamart - allow us to document a still contrasting economic picture for US imports.
After the uncertainties of 2023, with a negative annual trend both in dollar values (-5.8%) and in quantities (-4.4%), the first part of 2024 had opened with signs of moderate strengthening of US imports1, leading to a first-half year with a moderate year-over-year growth: +4.8% in dollar values, +3.6% in quantities.
In Q3-2024, there was - on the one hand - a consolidation of growth in dollar values, but - on the other - a simultaneous slowdown in measurement in quantity
The following graph highlights the dynamics of the most recent quarter, reporting the trend variations of US imports in dollars (brown bars) and in quantity (green bars).
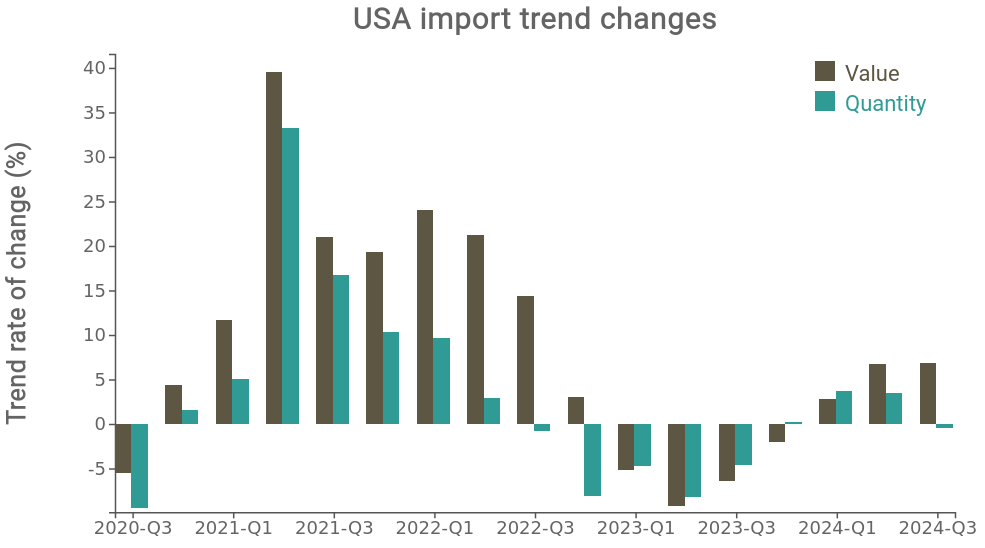
Source: ExportPlanning
In the period July-September 2024, US imports of goods are estimated to moderately accelerate in dollar values (+6.9% compared to the corresponding quarter of 2023, after the +4.8% trend in the first half), while they show a slowdown in the measurement in quantity (-0.4%, after the +3.6% trend in the first half).
The sectoral picture confirms the positive phase of consumer goods; contrasting signals, however, for intermediate goods and investment goods; demand for commodities is also weak.
The following table shows the year-over-year dynamics of US imports, for the various industrial macro-sectors, in the measurements in dollars and in quantity.
Year-over-Year changes of US imports by macro-sectors
| Year-over-Year % changes in dollars | |||
| Macro-sector | Y2023 | H1-2024 | Q3-2024 |
| Commodities | -17.1% | - 5.1% | + 0.3% |
|---|---|---|---|
| Intermediate Goods | - 5.0% | + 4.8% | + 4.5% |
| Consumer Goods | - 8.7% | + 9.3% | +11.0% |
| Investment Goods | + 2.9% | + 6.7% | + 8.8% |
| TOTAL Goods | - 5.8% | + 4.8% | + 6.9% |
| Year-over-Year % changes in quantity | |||
| Macro-sector | Y2023 | H1-2024 | Q3-2024 |
| Commodities | + 0.1% | + 1.0% | - 0.4% |
|---|---|---|---|
| Intermediate Goods | -11.5% | + 3.5% | + 1.4% |
| Consumer Goods | - 6.9% | + 6.6% | + 5.4% |
| Investment Goods | + 0.7% | +21.2% | -13.8% |
| TOTAL Goods | - 4.4% | + 3.6% | - 0.4% |
Source: ExportPlanning processing from Quarterly US Trade Datamart
The examination of the most recent trends in US imports by macro-sector confirms the positive trend results of the demand for consumer goods, which in the third quarter of the year recorded a +11.2% in dollar values (after the +9.4% of the first half of the year) and a +5.4% in quantities (substantially confirming the pace of the first half).
The difficulties identified during 2023 by US imports of consumer goods therefore appear to have been overcome.
In particular, we note the confirmation of double-digit percentage growth in dollar values for US imports of healthcare products and non-food consumer goods and "plus" signs (both in values and quantities) also for the fashion- and household- industries.
Contrasting signals, however, come from US imports of intermediate goods and capital goods. In the third quarter of the year, in fact, positive dynamics are evident for the trend variations in dollars (respectively +4.5 and +8.8 percent), while those in quantities are decelerating - also negatively (+1.4 percent for US imports of intermediates; -13.8% for capital goods).
It should also be noted that US imports of commodities are substantially stable: +0.3% trend in dollar values; -1.4% in quantities.
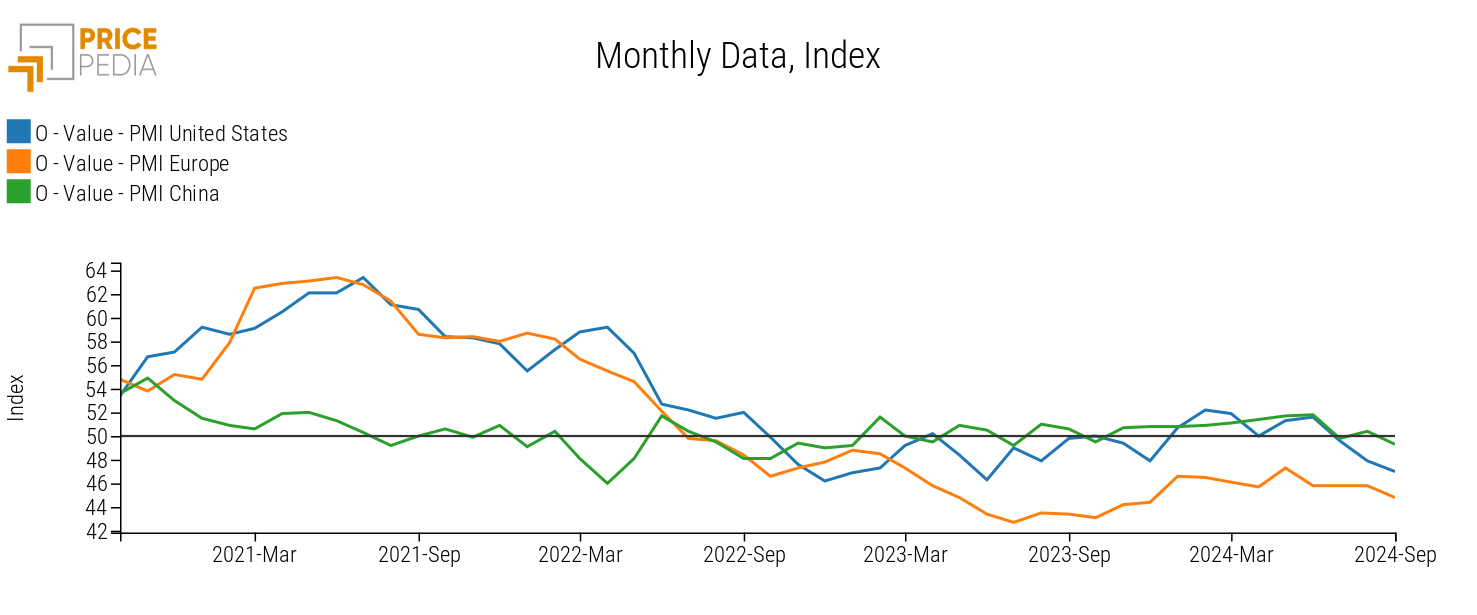
This appears to confirm that the purchasing decisions of US manufacturing companies are in a stalled phase, as indicated by the evolution of the American Purchasing Manager Index (PMI), which in the last three months (July-September 2024) has fallen below 50 (technical dividing line between expansion and reduction of orders in the US manufacturing industry), as has already been the case for some time in Europe (see the graph below).
Even in the phase of uncertainty that characterizes the purchases of the US manufacturing industry, there are still American B2B sectors in significant acceleration
Despite a general uncertainty within investment goods2, signs of acceleration in US imports of some industries should be highlighted: machinery (+18.5% y-o-y in dollars; +9.7% y-o-y in quantity), tools and equipment for ITC and services (+9.8% y-o-y in values in dollars and +21.1% y-o-y in quantity) and tools and equipment for industry (+11.9% y-o-y in dollars and +6.3% y-o-y in quantity).
In conclusion, the high dispersion of sectoral results and a constantly evolving context reconfirm the strategic importance for exporting companies of continuous monitoring of international markets, at the country/product level, in order to best support their international positioning.
1) See the following articles in this regard:
- “U.S. Foreign Trade Outlook: Recovery on the Horizon for American Demand?”;
- “U.S. Trade Conjuncture: The Recovery Continues”.
You may be interested in:

Previsioni di commercio mondiale: incertezza sistemica e dinamiche selettive di crescita
Published by Marzia Moccia. .
Total goods Global demand Forecast Foreign markets Uncertainty Foreign market analysisThe conflict in the Middle East is testing the resilience of the global economy, which so far has been supported by relatively favourable financial and fiscal conditions and by growing demand for tech}... [ Read all ]

Global Goods Trade in the first quarter: Rising Uncertainty
Published by Marzia Moccia. .
Slowdown Conjuncture Foreign markets Uncertainty Global economic trendsIn an international context marked by the re-emergence of geopolitical and trade tensions — compounded by the recent conflict in the Middle East — the outlook for 2026 in terms of economic growth an}... [ Read all ]

Woodworking machinery: global trade slows down
Published by Mauro Badanelli. .
Internationalisation Industrial equipment Conjuncture Foreign markets International marketingThe production of technologies for woodworking represents a strategic sector of Made in Italy, closely linked to the furniture and furnishings supply chain. In this context, Italy stands out internati}... [ Read all ]