Global Demand for Goods: Cyclical Focus on Regions and Sectors
Published by Marzia Moccia. .
Uncertainty Conjuncture Slowdown Foreign markets Export markets Global economic trendsAs anticipated in the article Conjunctural Overview of Global Trade: Trends in the First Nine Months of 2024, global trade in goods is projected to end 2024 showing an undeniable recovery compared to last year. However, indicators suggest a year-end that is more complex than initially anticipated. The nature of the international scenario also appears highly fragmented and differentiated in both geographical and sectoral terms. To support this observation, we present an analysis of overall results segmented by the world's major markets and industries.
The Trade Map by Industry
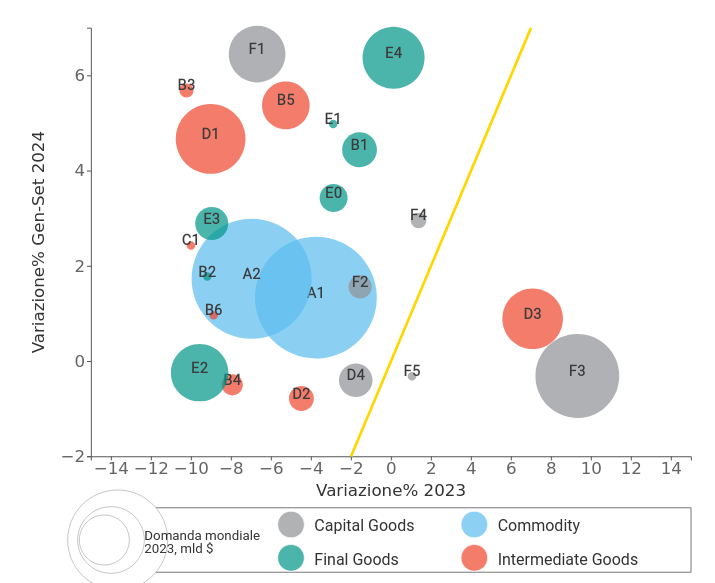
The following bubble map shows the main industries driving the trade of goods between countries, positioning them based on their rates of change at constant prices recorded in 2023 (X-axis) and in the first nine months of 2024 (Y-axis). Goods flows are measured at constant prices to provide a reading of real dynamics, excluding price changes. The yellow line indicates the bisector, highlighting industries in recovery (above it) and those in decline (below).
Fig.1 - World Demand Map by Industry at Constant Prices

Source: ExportPlanning Analysis
First, to provide an overview of the ongoing phenomena, it is clear that the recovery from the 2023 slowdown is affecting almost all industries. With an overall average change in trade of 2% at constant prices over the first nine months, it is possible to ideally divide the graph into three horizontal areas.
The first area is the top, corresponding to a change between 4% and 6% in quantity during the first nine months of the current year. In this part of the representation, we see the industries recovering the most compared to 2023 dynamics – measured as distance from the bisector. Industries showing the most marked change include Intermediate Chemical Goods (B5), Paper and Wood (B3), as well as ICT Equipment and Tools (F1) with the related intermediate Electronics Components (D1) supply chain. Also driving the recovery of global demand for goods is the typically "a-cyclical" consumer goods cluster, such as the Fresh Agrifood (B1), Packaged Food (E0), and Health System (E4). This latter cluster includes segments that remained stable even in 2023.
The second area is the horizontal section around 2%. This typically includes natural and industrial raw materials (A1 and A2), experiencing a strong rebound compared to last year, reflecting the bearish phase in raw material prices that affected most of the year. The global trade of Machinery (F4) and Industrial Tools (F2) is also positioned here. Despite being resilient to a context of restrictive monetary policies, these trades appear consistent in performance compared to 2023 dynamics.
The last area lies close to 0% real growth. In this section, the sharp slowdown in automotive trade draws attention, both in terms of transport vehicles (F3) and intermediates (D3), which seem to have exhausted the positive contribution to global demand that characterized 2023 (including a cooling of electric vehicle trade). Further signs of difficulty in the automotive sector are seen in the weaker trade of Metal Intermediates (B4) and Mechanical Components (D2), both significant within the supply chain. The trade of Electrical Goods (D4) is also slowing. Upcoming data will tell us more about the nature of this deceleration and the implications for the future of the green transition.
For consumer goods, the only segment in this area is the Fashion System (E2), reflecting a still-weak situation in the sector.
The Trade Map by Destination Area
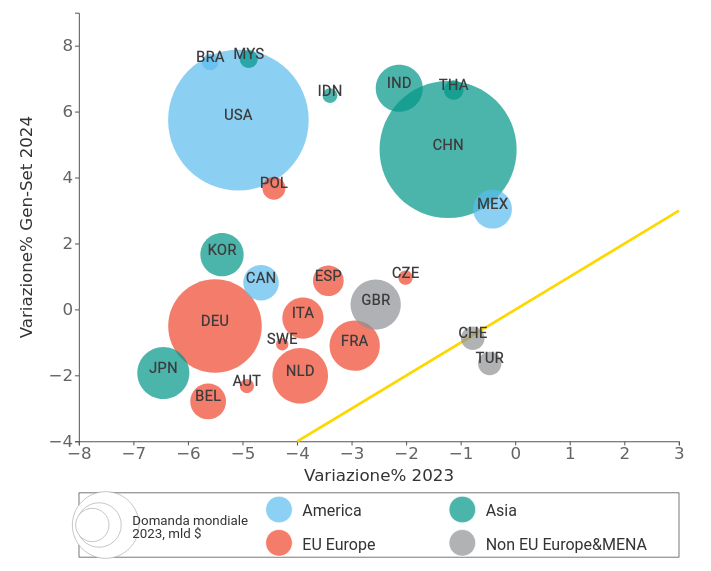
Equally interesting is the detailed profile by markets: the following graph, organized like the previous one, provides a clear and concise overview of demand changes for each geography, divided into five color-coded macro-areas: America, Asia, EU Europe, Non-EU Europe, and MENA. The circle sizes represent the import volume of each country in billions of dollars in 2023.
Fig.2 – Map of the Largest Importers in the World at Constant Prices

Source: ExportPlanning Analysis
A first significant point is that almost all economies are positioned above the yellow bisector, indicating that the recovery is involving the majority of the world's major importers.
Here again, we can ideally identify three horizontal bands: at the top are the economies leading the recovery, in the middle are those recovering in line with the global average, and at the bottom are the economies still facing difficulties.
In the first group, among the fastest-growing countries, we find the two giants of international trade: China and the United States. They are joined by the major ASEAN economies such as Malaysia, Indonesia, India, and Thailand. Also noteworthy are Brazil and Poland, the latter moving against the trend of other European economies. Mexico also shows strong performance, emerging as an increasingly strategic hub for the USA in recent months.
The second group includes countries registering a moderate recovery. Among these are the Czech Republic and Spain, relatively resilient European economies, along with South Korea and Canada.
Finally, in the last group "flattened" around 0%, we find the major European economies, characterized, along with Japan, by a still-weak manufacturing recovery.
Among non-EU Europe & MENA countries, Switzerland and Turkey show signs of weakness in the first nine months of 2024, although they held steady during last year's crisis.
As anticipated, the international situation remains complex, with ongoing signs of both strengths and weaknesses. America and Asia show the strongest growth signs, while Europe, especially the European Union, appears more vulnerable, with a highly fragmented sectoral landscape.


