Electrotechnical and Electronic technologies: the driving role of the US market in the first 3 quarters of 2024
In a context of weakly recovering global demand for the sector, the US market is offering the most favourable growth contributions
Published by Marcello Antonioni. .
American States United States of America Export markets Conjuncture Foreign market analysisWorld demand for Electrotechnical and Electronic technologies
The international trade data for the third quarter of 2024, available in the Quarterly World Trade Datamart, highlight signs of improvement in world demand for Electrotechnical engineering1 and Electronics technologies2.
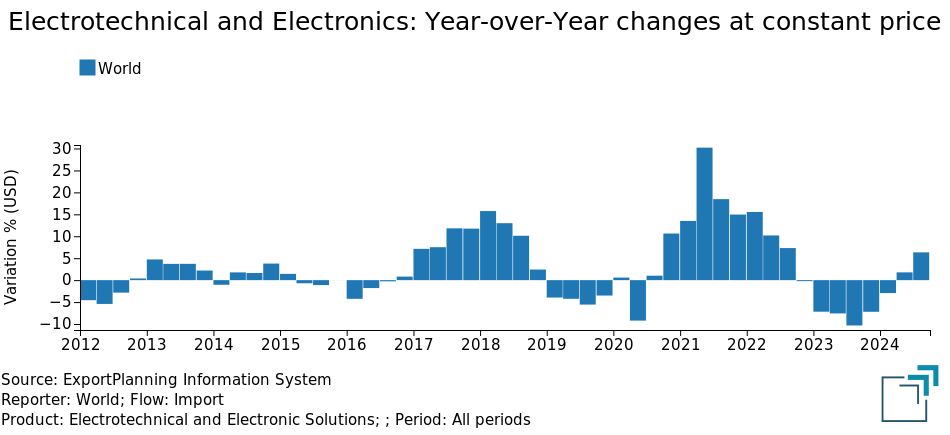
As documented in the graph below, after a first quarter of the year still in negative territory (for the fifth consecutive time), in the following two quarters world demand for the sector recorded a progressive improvement, culminating in the most recent quarter in a Year-over-Year growth of 6.3 percent when measured at constant prices3.
In cumulative terms (January-September 2024), the balance is, however, only slightly positive (+1.7% at constant prices) compared to the corresponding period in 2023.

Slowest/fastest international markets of the sector
In the first 9 months of 2024, global demand for Electrotechnical Engineering and Electronics was penalized above all by drops in imports from numerous European markets; as highlighted in the table below, the Year-over-Year drops in Germany (-7.6 billion euros, equal to -9.3%), Netherlands (-6.6 billion euros, equal to -16.7%), Belgium (-2.6 billion euros, equal to -20%) and France (-19 billion euros, equal to -7.3%) should be highlighted above all.
World Trade of Electrotechnical and Electronic technologies:
main driving/restraining markets in the period January-September 2024
| January-September (billions of euros) | |||
| Market | 2023 | 2024 | Delta 2024/2023 |
| United States | 165.5 | 191.3 | +25.8 |
|---|---|---|---|
| Hong Kong | 119.7 | 137.4 | +17.8 |
| Vietnam | 55.3 | 69.1 | +13.8 |
| Taiwan | 50.0 | 61.9 | +11.9 |
| China | 100.1 | 107.7 | + 7.6 |
| France | 26.1 | 24.2 | - 1.9 |
| Belgium | 12.8 | 10.2 | - 2.6 |
| Japan | 27.3 | 24.2 | - 3.1 |
| Singapore | 42.2 | 38.4 | - 3.7 |
| Netherlands | 39.8 | 33.2 | - 6.6 |
| Germany | 81.5 | 73.9 | - 7.6 |
Source: ExportPlanning processing from Quarterly World Trade Datamart
To the above-mentioned declines, we must add the Year-over-Year declines in imports of Electrotechnical Engineering and Electronics from Singapore (-3.7 billion euros compared to the first 9 months of 2023) and Japan (-3.1 billion euros).
On the other hand, we should highlight - above all - the Y-o-Y growth performance of the US market (+25.8 billion euros compared to the corresponding period in 2023), largely confirming itself as the world's leading market for Electrotechnical Engineering and Electronics.
We should also highlight the positive contributions of imports of Electrotechnical Engineering and Electronics from the following Asian markets: Hong Kong (+17.8 billion euros compared to the first 9 months of 2023), Vietnam (+13.8 billion €), Taiwan (+11.9 billion €) and China (+7.6 billion €).
US Imports of Electrotechnical and Electronic technologies
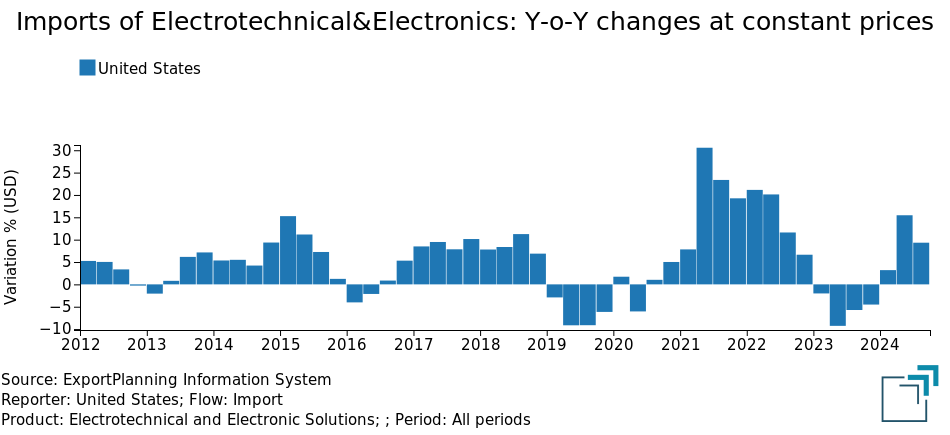
In the first three quarters of the year, US imports of Electrotechnical Engineering and Electronics (see the graph below) showed a Year-over-Year growth of over 9 percentage points at constant prices compared to the corresponding period in 2023.

US imports of the sector by American State
The analysis of US imports of Electrotechnical and Electronic technologies by reporting State (see the table below) highlights California recording by far the largest trend increases in the first 9 months of the year (+10.9 billion euros), confirming its first place overall in terms of the value of imports of the sector.
Behind it, there are the trend increases in imports of Electrotechnical and Electronics of Kentucky (+4.8 billion euros, rising to fifth place overall among the American States for imports of the sector in 2024), Texas (+3 billion euros, confirming its second place overall in the 2024 ranking of imports of the sector sector), Oregon (+2.5 billion €, rising to tenth place among the American states for imports of the sector in 2024).
US imports of Electrotechnical and Electronic technologies:
fastest-growing American States in the first 9 months of 2024
| January-September (millions €) | |||
| American State | 2023 | 2024 | Delta 24/23 |
| California | 37 335 | 48 234 | +10 899 |
|---|---|---|---|
| Kentucky | 2 056 | 6 860 | + 4 804 |
| Texas | 27 412 | 30 378 | + 2 966 |
| Oregon | 2 296 | 4 774 | + 2 478 |
| New Mexico | 1 233 | 2 956 | + 1 723 |
| Idaho | 2 180 | 3 459 | + 1 279 |
| Tennessee | 5 029 | 6 279 | + 1 250 |
| Georgia | 6 761 | 7 876 | + 1 115 |
Source: ExportPlanning processing on Quarterly Trade of American States Datamart
It is also worth highlighting the Year-over-Year increases in the first 9 months of the year for sales of Electrotechnical Engineering and Electronics to the states of New Mexico (+3.1 billion euros, in fourth place among the American states for absolute value in the first three quarters of 2024), Idaho (+1.3 billion euros), Tennessee (+1.3 billion euros, up to 6th place among the American states for 2024 imports of the sector) and - last but not least - Georgia (+1.1 billion euros, in 3rd place overall among the American states for imports of the sector).
Conclusions
The analysis of world trade in Electrotechnical Engineering and Electronics shows a demand picture that is still overall uncertain, although with recent signs of reacceleration.
World demand for the sector sees, above all, the weakness of many European markets, compared - instead - to a favorable context of numerous Asian markets and - above all - of the US market.
The analysis of the most dynamic American states in terms of imports of Electrotechnical Engineering and Electronics highlights, above all, the leadership of California. Other American States with notable Y-o-Y increases in imports of the sector include Kentucky, Texas and Oregon.

1) See the list of products included in this analysis in the following description table.
2) See the list of products included in this analysis in the following description table.
3) The measure Quantities at constant prices (Q). This measure includes a deflation operation, in which the historical series of monetary values (V) has been transformed into an analogous series of values expressed at constant prices, with a reference to a given year, known as the base year. For a description of the methodology applied, please refer to Methodological Note on the Quarterly World Trade Datamart.


