Packaged food and beverage: after a positive acceleration in 2024, which markets have high potential in 2025?
Opportunities from markets undergoing structural growth of imports in the industry
Published by Silvia Brianese. .
Food&Beverage Uncertainty Foreign markets Export markets Foreign market analysis
In 2024, acceleration of world trade
in Packaged Food and Beverage...
Last year, world trade in Packaged Food and Beverage1, after the slowdown in 2023 (+1.6% in euro values, after the average annual growth of +15.8 percent in the previous two years), showed an growth acceleration, with a final result of +5.8 percentage points in the ExportPlanning pre-estimates, reaching a new absolute maximum, estimated at over 720 billion euros, about 220 billion higher than pre-pandemic values).
.. with growth both in euro values
and in the measurement at constant prices
It should also be highlighted that, net of price and currency dynamics (constant prices2), last year global trade in Packaged Food and Beverage, after the reduction of the previous year, was able to return to growth (+5.1 percentage points compared to 2023). Also in this case, global trade in the industry, measured at constant prices, reached a new high, 11 percentage points higher than pre-pandemic levels.
The 2024 recovery of world trade measured at constant prices has affected all the main sectors of the agribusiness industry
World trade in Packaged Food and Beverage
| Values 2024E |
% changes at current prices |
% changes at constant prices |
|||
| Sector | (Bn €) | 2024/'23 | 2024/'19 | 2024/'23 | 2024/'19 |
| Meat and Fish (processed and packaged) | 155 | + 5.2 | +33.2 | + 4.2 | + 8.2 |
|---|---|---|---|---|---|
| Alcoholic Beverages | 91 | - 1.7 | +17.9 | + 0.1 | - 1.6 |
| Dairy products | 90 | + 2.5 | +32.2 | + 0.8 | + 1.6 |
| Confectionery | 75 | + 9.6 | +65.0 | + 4.6 | +13.2 |
| Rice, Pasta, Flour (packaged) | 60 | +17.8 | +74.1 | +23.7 | +47.8 |
| Oil, Condiments, Spices | 58 | + 7.8 | +82.7 | + 5.7 | +17.9 |
| Vegetables&Fruit (processed and packed) | 56 | + 3.7 | +40.9 | + 3.0 | + 4.9 |
| Bakery goods | 55 | + 5.9 | +62.9 | + 4.5 | +22.1 |
| Water and Soft Drinks | 53 | + 9.5 | +48.6 | + 5.1 | +16.7 |
| Tea and Coffee (packaged) | 30 | + 7.8 | +48.8 | + 6.1 | + 9.9 |
| TOTAL | 721 | + 5.8 | +43.8 | + 5.1 | +11.4 |
Source: ExportPlanning-Annual Trade Flows Datamart
In particular, the greatest accelerations concerned the Rice, Pasta Flour (packaged) sector (with world trade increasing at constant prices by almost 24 percentage points compared to 2023, reaching levels of around 48 percentage points higher than pre-pandemic levels).
It is also worth highlighting the positive performance of world trade in Oil, Condiments, Spices (+5.7% last year in constant prices, at levels of around 18 percentage points higher than pre-pandemic levels), Water and Soft Drinks (+5.1% last year in constant prices, at levels of around 17 percentage points higher than pre-pandemic levels) and Bakery goods (+4.5% in the measurement at constant prices, on levels of over 22 percentage points higher than pre-pandemic levels).
On the other hand, although slightly increasing, the weak performance of world trade, measured at constant prices, is noted for Alcoholic Beverages (+0.1% compared to 2023, on levels not dissimilar to pre-pandemic levels) and Dairy Products (+0.8% compared to 2023, with a gap of just 1.6 percentage points compared to 2019).
Despite a context of strengthening of the international outlook of the industry, several markets of Packaged Food and Beverage still appear to be disturbed
The quarterly evolution of world exports of Packaged Food and Beverage, measured at constant prices (see the graph below), shows a profile of overall strengthening, with 4 consecutive quarters of trend increases in global sales of the industry.
However, the geographical profile of growth still appears uneven. Proof of this is the fact that at the end of 2024, many relevant markets show lower levels of imports in the industry than pre-pandemic levels; above all Russia (-38.1%, equal to almost 4 billion euros), Hong Kong (-18.9%) and China (-4.8%), for an overall decrease of 1.8 billion euros, Japan (-7.6%, equal to -0.9 billion euros), United Kingdom (-3%, equal to -0.7 billion euros), in addition to the modest growth of the markets of Germany (+0.3%, equal to +0.1 billion euros) and France (+5%, equal to +0.9 billion €).
Packaged Food and Beverage Markets in Growth Phase: Some Case Studies
The current context of global economic and political uncertainty makes it increasingly clear that it is necessary to diversify destination markets for exporters, including those of agri-food products. From this perspective, the use of models based on machine learning techniques applied to international trade data allows us to identify countries where imports of certain goods are experiencing significant growth, thus representing strategic opportunities for exporting companies3.
The analysis conducted on the Packaged Food and Beverage sectors highlights a growth in imports in markets such as Vietnam, Chile, Philippines, Azerbaijan, Kazakhstan and Serbia.
The following table shows the number of products in the growth phase of imports of the six markets considered, divided by the main sectors of the agribusiness industry.
Number of products according to the Harmonized System (HS) classification
identified, for each country, in the phase of import growth
| Oil, Condiments, Spices | Dairy products | Meat and Fish (processed and packaged) | Vegetables&Fruit (processed and packaged) | Sum of Sectors | |
| Vietnam | 2 | 2 | 9 | 12 | 25 |
|---|---|---|---|---|---|
| Chile | 2 | 4 | 11 | 4 | 21 |
| Philippines | 2 | 1 | 9 | 4 | 16 |
| Azerbaijan | 2 | 2 | 6 | 4 | 14 |
| Kazakistan | 2 | 2 | 6 | 3 | 13 |
| Serbia | 2 | 3 | 3 | 2 | 10 |
Source: StudiaBo on ExportPlanning Information System
Note: the table does not include all the sectors of the Packaged Food and Beverage industry, but only those with the highest number of products with growing imports
Although the number of products with growing imports is relatively limited, Vietnam and Philippines remain a growing market in the Confectionery sector, with increasing demand for products such as candied fruit (especially in Vietnam), chocolate in bars or containers, and solid cane or beet sugar.
With regard to the Alcoholic Beverages sector, in addition to Vietnam and the Philippines, Chile also shows signs of growth in imports in this sector. In particular, all three countries are recording an increase in imports of undenatured ethyl alcohol; Vietnam is also showing growing interest in grape must, while Chile stands out for its increase in imports of gin and juniper spirits.
The results of the table are further confirmed by analyzing the historical series of imports for each sector of the agri-food sector, focusing on the countries with the highest number of growing products.
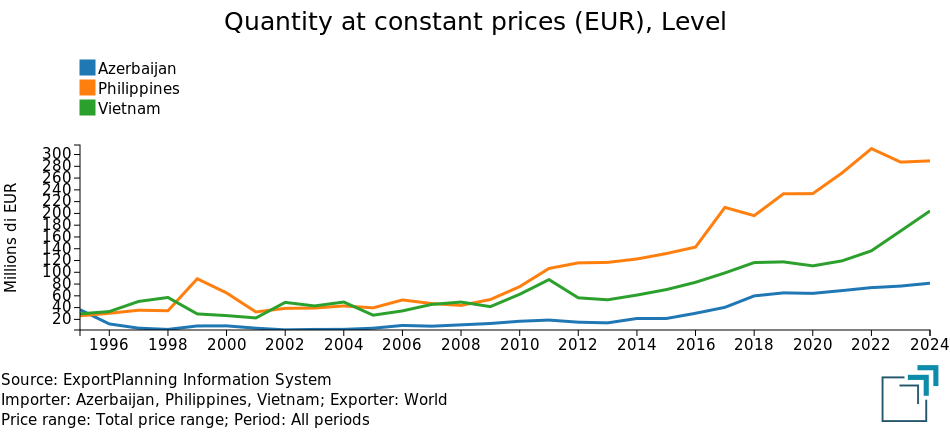
In particular, Azerbaijan, Philippines, Vietnam, Kazakhstan emerge as growing markets for imports of Oil, Condiments, Spices, especially for virgin olive oil (EU cat.2), crude olive pomace oil (EU cat.6) and pepper of the Piper genus.
Oil, Condiments, Spices: imports from Azerbaijan, Philippines, Vietnam
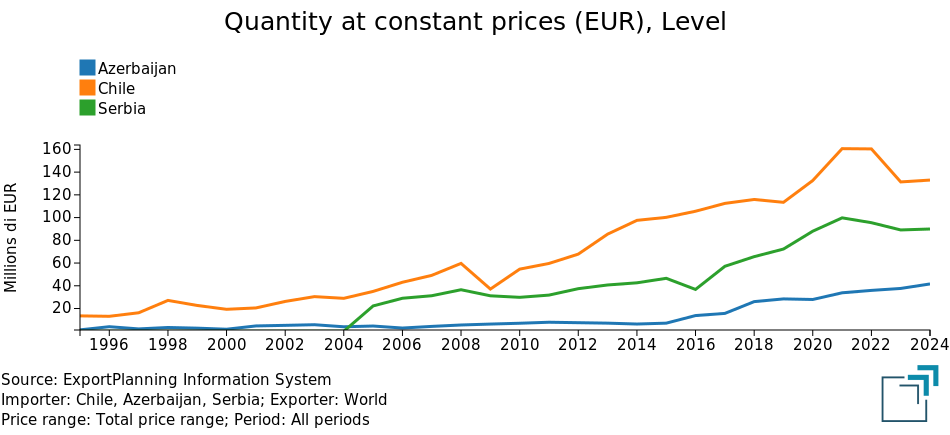
As for dairy products, in addition to Azerbaijan, Chile and Serbia also emerge as markets with the highest number of products experiencing import growth, with increasing demand especially for grated or powdered cheeses of all kinds, milk and cream, and fresh unripened cheese.
Dairy products: imports of Azerbaijan, Chile, Serbia
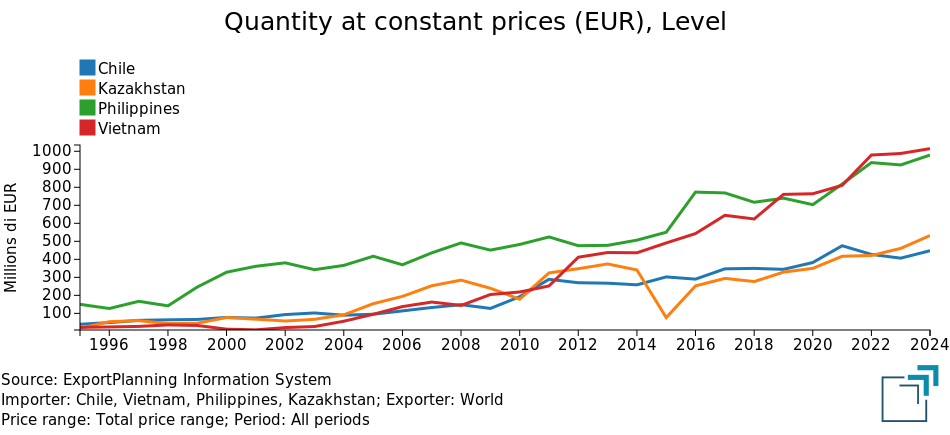
In the Meat and Fish (processed and packaged) sector, Vietnam, Philippines, Chile and Kazakhstan are establishing themselves as structurally growing markets for imports of these products, particularly frozen octopus and squid, meat- or fish-based preparations and preserves, mollusks and crustaceans (such as clams, mussels, and scallops), non-deboned pork hams and shoulders, as well as stuffed pasta.
Meat and Fish (processed and packaged): imports of Chile, Kazakhstan, Philippines, Vietnam
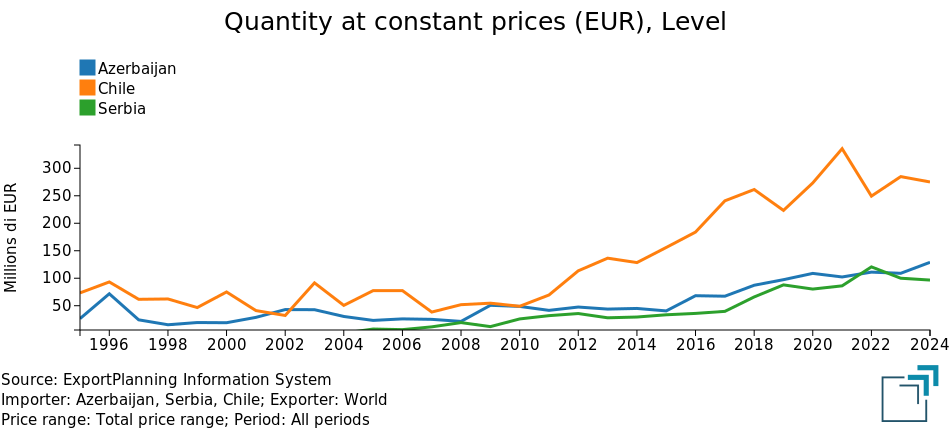
In the Vegetables&Fruit (processed and packaged) sector, Azerbaijan, Chile and Serbia are the markets showing the highest number of products with structurally growing imports. Key categories include: dried or shelled fruit, citrus or melon peels, frozen raspberries and blackberries, prepared pears, tomatoes, and preserved or prepared mushrooms.
Vegetables&Fruit (processed and packaged): imports of Azerbaijan, Chile, Serbia
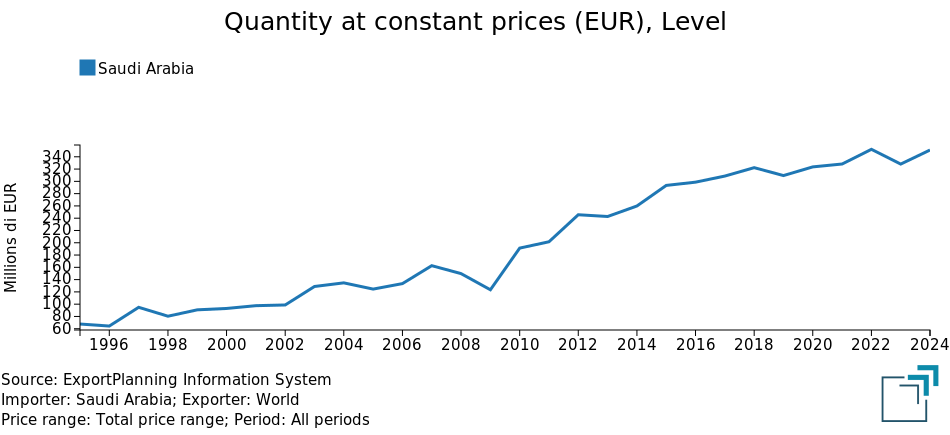
Lastly, Saudi Arabia also stands out among the key high-potential markets for agri-food exports, despite the relatively limited number of products showing structural growth across various segments. Notably, there is an increase in imports in the Oils, Condiments, Spices sector, with specific interest in wine vinegar, soy sauce, peanut oil, and olive oil (EU categories 7 and 8).
Saudi Arabia's Imports of Oil, Condiments, Spices
Conclusions
Although 2024 recorded a strong recovery in global trade of packaged food and beverages, geographically heterogeneous dynamics persist, with signs of contraction in some key markets, particularly in Asia and Europe, where a decline in agri-food imports has been observed.
In this context, diversifying the destination markets of exporters remains a strategic priority for the agri-food industry as well. The use of machine learning techniques applied to international trade data enables more accurate identification of markets undergoing a structural growth phase in imports, thus representing new development opportunities.
The analysis presented therefore offers an operational tool to support exporting companies, useful both for strengthening their position in already consolidated markets and for identifying new high-potential geographies in the Packaged Food and Beverage industry.
1) For a list of the sectors analysed, please refer to the relevant industry description.
2) The measure Quantities at constant prices (Q) includes a deflation operation, in which the historical series of monetary values (V) has been transformed into an analogous series of values expressed at constant prices, with a reference to a given year, known as the base year. For a description of the methodology applied, please refer to Database Ulisse: Methodological Note.
3) Also see the following articles:
You may be interested in:

Fashion Products: after the last two years of high uncertainty, which destinations have high potential for 2025?
Published by Silvia Brianese. .
Fashion Uncertainty Foreign markets Export markets Foreign market analysisOpportunities from markets undergoing structural growth of imports in the industry [ Read all ]

The export of Prosecco PDO in light of Trump’s new tariffs
Published by Silvia Brianese. .
Export Importexport Italy Uncertainty Made in Italy United States of America Foreign markets Export markets Foreign market analysisWhich alternative markets for Prosecco PDO following the new U.S. tariff measures [ Read all ]

Transatlantic relations and Trump's tariffs
Published by Simone Zambelli. .
United States of America Uncertainty Europe Industries Global economic trendsWhile waiting for the "tariff showtime" of the new administration, here's an overview of the current trade relations between the European Union and the United States [ Read all ]