US-China Phase One Deal: Tracking Progress in 2020
US Exports to China Lag Behind the “Phase One” Commitments
Pubblicato da Lorenzo Fontanelli. .
United States of America Trade balance Importexport Free trade agreements Global Economic Trends
While 2020 will go down in history for the Covid-19 pandemic, in the fields of trade and geopolitics it will also be remembered as the year in which the “Phase One” agreement between the US and China went into effect. Signed by the two countries more than a year ago (January 15, 2020), the deal aims at pausing a nearly two-year-long trade spat between Washington and Beijing. At the time of signature, the former US President trumpeted the agreement as a huge breakthrough, saying it would represent a “momentous step” in trans-pacific commercial relations.
Though its signing may have mitigated uncertainty in financial markets, an in-depth analysis is required to find out whether the Trump’s administration high expectations towards the deal have succesfully been met.
A key part of the agreemeent includes the commitment from China to increase its imports of American products in 2020 and 2021. Specifically, China agreed to purchase $200 billion more of US goods and services compared to 2017, by the end of 2021.
Covered products are clustered into three broad categories, namely manufactured goods, agriculture and energy: for each of these categories, US exports in 2020 - relative to 2017 baselines - should increase respectively by $32.9, $12.5 and $18.5 billion. Overall, China therefore committed to purchase no less than an additional $63.9 billion of covered goods from the United States by the end of 2020, relative to 2017 baselines.
Targets and reality
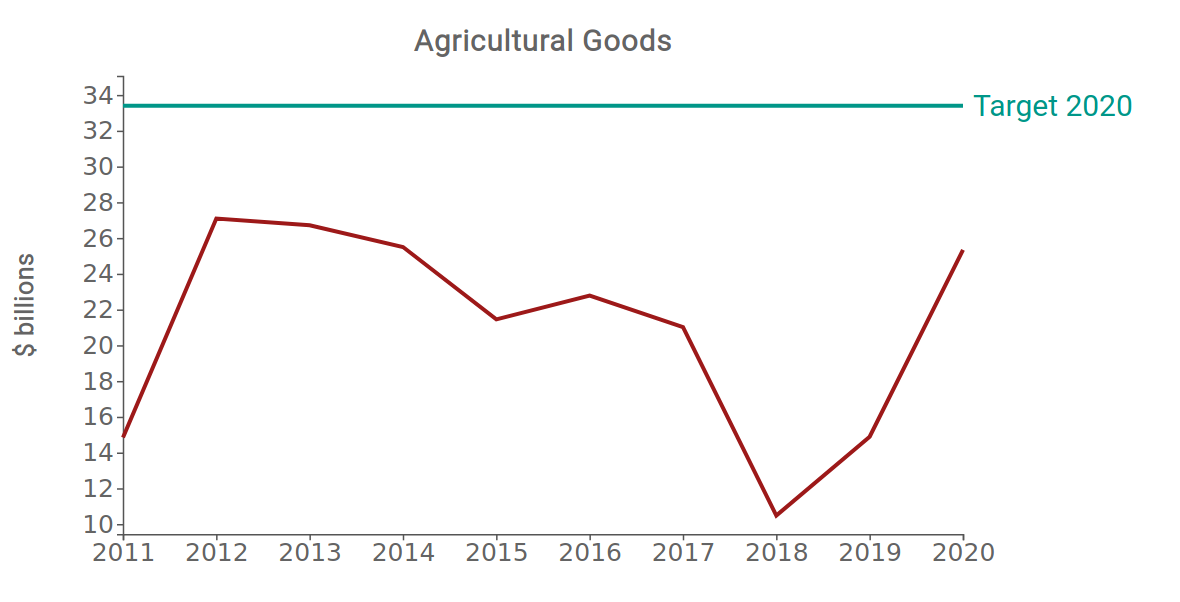
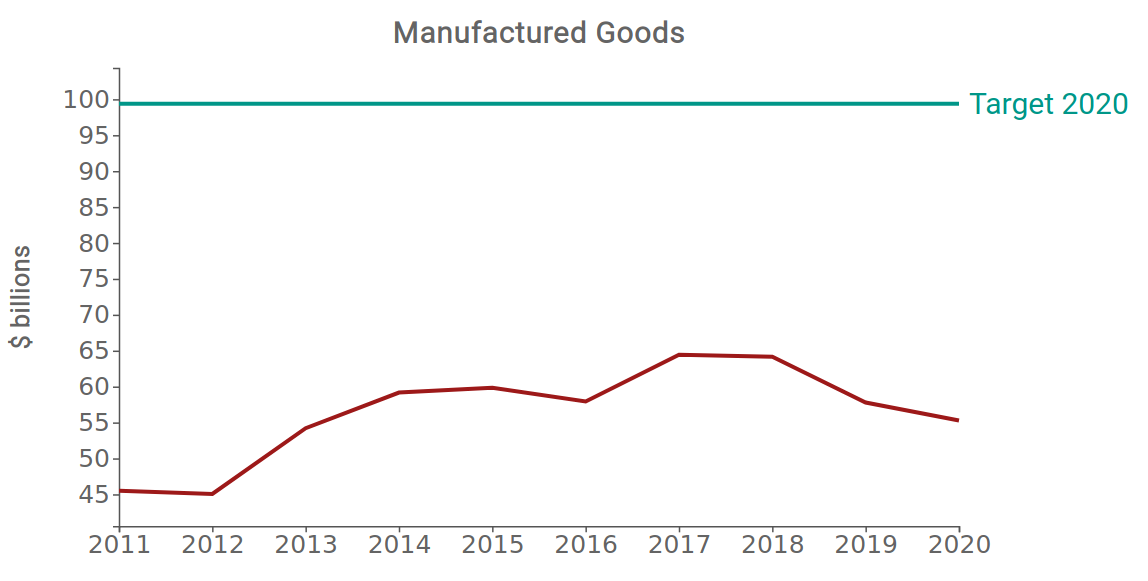
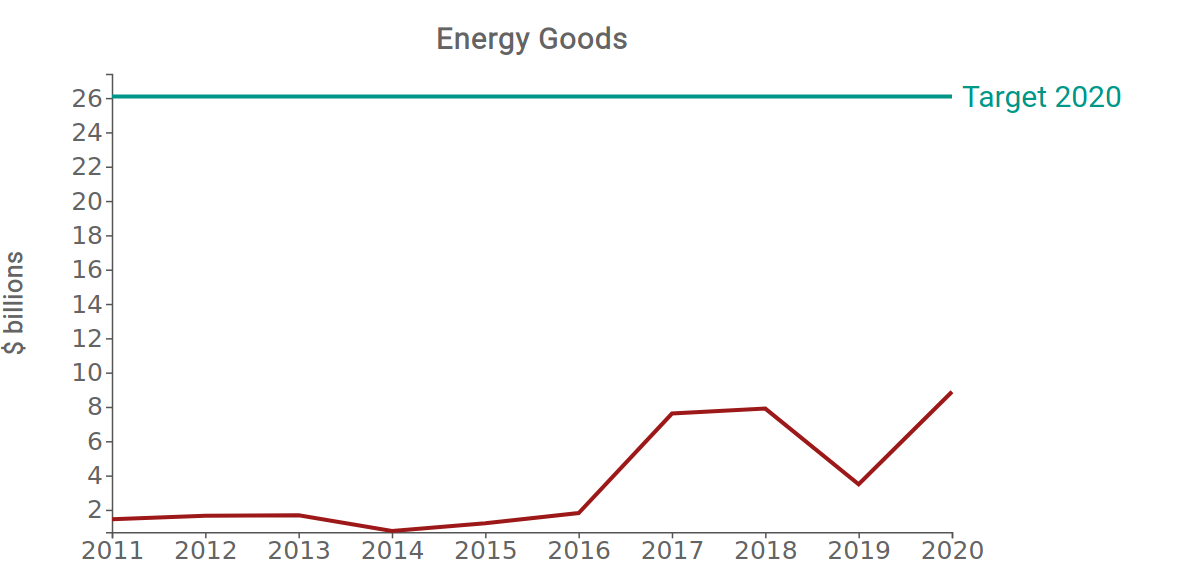
The graphs below illustrate the development of US agricultural, manufacturing and energy exports to China. As you may observe, some sectoral exports scored better than others in 2020: whereas the country came close to fulfilling its agricultural exports, it did most poorly on the manufacturing and energy targets. Across the last year, US agricultural exports amounted to approximately $25 billion, against a target of $33.4 billion. Over the same period, US exports of energy products were $8.8 billion, compared with an expected first-year figure of $26.1 billion. Certainly, exporters of manufactured goods are among the furthest from the objective set in the deal: despite an annual target of $99 billion, US exports to China equalled just $55.2 billion as of December 2020, thus even marking a decline compared to 2019 levels.
US Exports to China (2011-2020)
Source: ExportPlanning
The poor performance in manufacturing exports requires further investigation with regard to the specific industries involved: throughout 2020, some of them exported more than others - as shown in the graph below. Amid the disruption of the global pandemic, Chinese demand for US products in fact decreased quite significantly for both Vehicles (-16.9%) and Aircrafts (-64%), whilst increasing markedly for Iron and steel (+44%). At the same time, US exports of Electrical equipments and Industrial machineries grew at a similar pace (respectively +8.16% and +8.8% YoY). Finally, exports of Pharmaceutical products to China recorded a slowdown in their growth rate in 2020 (+13% YoY, compared to +48% in 2019), though it might bounce back as vaccinations pick up speed around the world.
Total manufacturing exports, however, only reached 55.5% of the phase one annual target, hence remaining far below the expectations.
Source: ExportPlanning
US-China trade balance
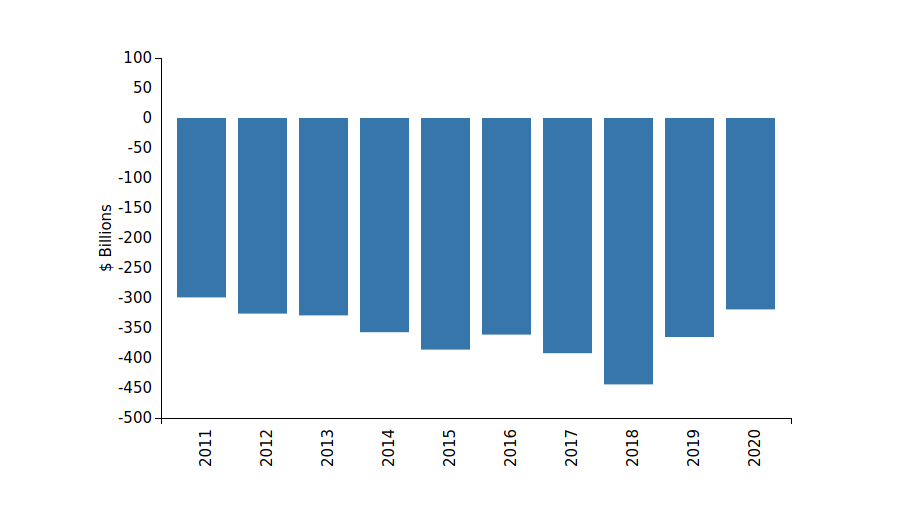
Trade dynamics between the US and China have direct implications on the countries’ balance of payments. The following graph represents the change recorded by the US bilateral trade balance with China, as far as goods are concerned. After hitting a record low in 2018 (-$444 billion), the US goods’ balance vis-à-vis China has recovered some ground in the following two years, although largely remaining into negative territory: the deficit amounted to -$365 billion in 2019 and -$319 billion in 2020. This fall, however meaningful, stems from the temporary halt of China’s economy in the first months of 2020, thus hiding behind more Chinese demerits than US merits. Indeed, total US exports to China accomplished only 56% of their 2020 target.
US Trade Deficit with China (Goods)
Source: ExportPlanning
Conclusions
One year after it entered into force, the “Phase One” agreement is under scrutiny by the Biden administration. As a matter of fact, none of the categories covered by the treaty lived up to the first year’s purchase objectives. Moreover, US exports of manufactured goods turned out significantly lower than the desidered target, wrecking President Trump’s attempts to shape trade policy to the advantage of American manufacturing. While it is true that Covid-19 and the ensuing global economic malaise posed a threat to a “Phase One” prompt success, it can not serve as a complete explanation for non-compliance. Seeking to reorient US economic relations with China, with the Phase One Deal still in force for the time being, President Biden should find suitable ways to guide this year’s commitments to fulfillment; if not, the deal will turn out to be a debacle.
Potrebbero interessarti anche:
US-China Phase One Deal: Tracking Progress H1-2021
Pubblicato da Gloria Zambelli. .
United States of America Slowdown Free trade agreements Asia Global Economic TrendsU.S. exports to China are not flourishing despite the commitment with the "Phase One" agreement [ leggi tutto ]

US Vehicles Components: an Update
Pubblicato da Gloria Zambelli. .
United States of America Importexport Electronics Automotive Global Economic TrendsEconomic recovery proceeds, although still marked by uncertainty [ leggi tutto ]

US Export Trends: Q2-2021 Figures
Pubblicato da Lorenzo Fontanelli. .
United States of America Macroeconomic analysis Importexport Global demand Global Economic TrendsExports during 2021-Q2 hit record high as they outpace pre-pandemic levels. Growing demand for American-made food and electronic parts [ leggi tutto ]