Environmental Goods: Challenges and Opportunities for US Foreign Trade
Green products show a marked heterogeneity in their export performance; in the field of e-vehicles, the EU market represents a growing reality.
Pubblicato da Lorenzo Fontanelli. .
United States of America Total goods SME Global demand Foreign markets Export markets Consumption pattern Global Economic Trends
The current decade has the potential to be a period of rapid advancement on climate change.
As members of the 2015 Paris Conference gear up for this year’s meeting (scheduled for November), the spotlight falls on the US after a four-year absence from global climate negotiations. Rolling back Trump’s environmental policies is definitely among President Biden’s top priorities, though legal experts warned that it could take years to undo Trump’s legacy.
An attentive analysis of US international trade data might be useful to understand which types of goods are directly involved in this change.
The size and complexity of the environmental sector has implications for the goal of grasping potential trade opportunities related to environmental goods; this is due both to the huge variety of products encompassed by the sector, as well as the lack of a detailed, internationally-agreed classification.
Composed of 54 environmental goods, the APEC (Asia-Pacific Economic Cooperation) classification is the most widely accepted. It is structured into seven categories, namely Air Pollution Control, Environmental Monitoring, Analysis and Assessment Equipment, Environmentally Preferable Products, Management of Solid and Hazardous Waste and Recycling Systems, Natural Risk Management, Renewable Energy Plant and Waste Water Management and Potable Water Treatment.
In 2019, the United States exported environmental goods valuing around $65 billion, whilst goods imported from international trading partners amounted to $74 billion.
US Exports of Environmental Goods: Structure and Performance in 2020
Below is a treemap where rectangles stand for the different above-mentioned categories of “green” products, and whose size is proportional to overall US exports of the specific category in 2019. The compound annual growth rate between 2015 and 2019, along with the growth rate recorded in 2020, have been calculated with the aim to provide a comprehensive overview of the current status of the American environmental industry.
US Environmental Exports by Category
about export values and growth rates.
Source: ExportPlanning
The latest ExportPlanning data provide proof of a marked heterogeneity in US export performance. Environmental Monitoring Product and Renewable Energy Plant account for nearly half of total “green” exports in 2019, respectively accounting for $17.7 and $17.8 billion; yet, both experienced negative growth rates across the pandemic year (-6% for the former and -11.8% for the latter). Whereas exports of Waste Water Management, along with Management of Solid and Hazardous Waste, fell by 11% in 2020, products linked to Natural Risk Management records a tremendous -27% drop.
The fastest-growing category relates to Environmentally Preferable Products (EPP), which registers an undoubtedly positive compound annual growth rate between 2015 and 2019 (+7.3%). That is fueled by a stunning increase in exports over the last years: between 2018 and 2019, American exports of the cluster skyrocketed by almost 90%. Importantly, the Covid-19 pandemic has not brought international sales to a halt: whereas sales of other environmental goods decreased significantly last year, Environmentally Preferable Products grew by a remarkable 7%. This is mainly due to the rising global demand for electric vehicles, which are responsible for the largest portion of EPP trade.
E-vehicles: the Relevance of the EU Market
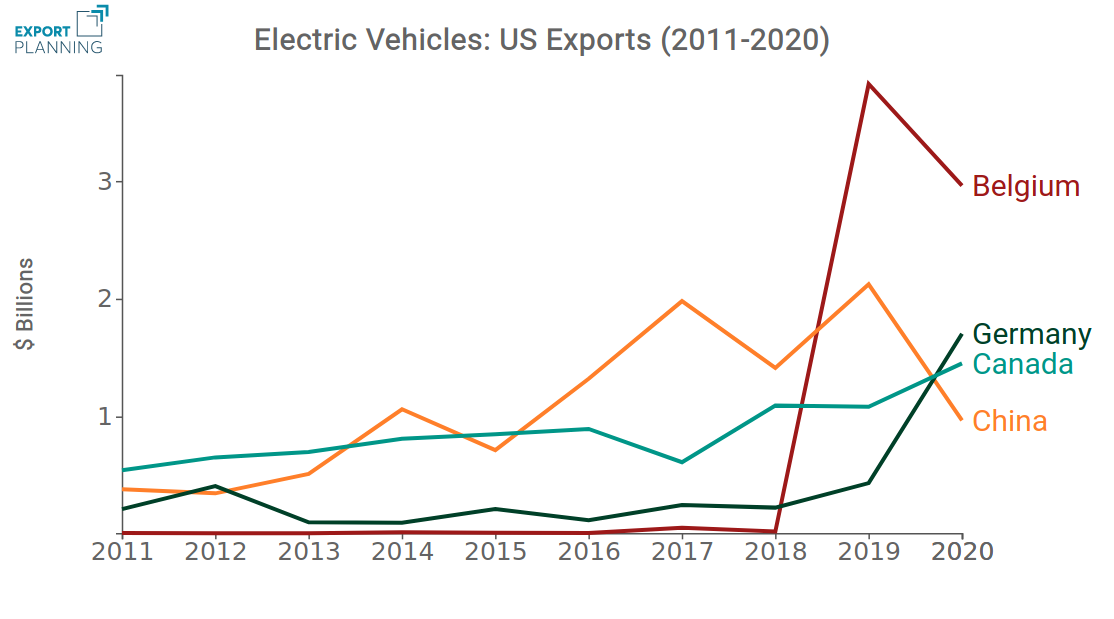
As far as electric vehicles are concerned, the EU market represents a growing reality, as can be seen from the following chart which shows the dynamics of exports towards the four main importers of American e-vehicles.
Source: ExportPlanning Elaborations
We may easily observe that Belgium far surpasses Germany as leading importer. Particularly, sales to Belgium went from just $24 millions in 2018 up to a record $3.8 billion in 2019. US exports to Belgium surged after the American carmaker Tesla announced, in early 2019, that it would be transporting the newest e-vehicles models through the Port of Zeebrugge – one of Flander’s international seaports and the world’s largest car terminal – before redistributing them to European customers (source: Flanders Investment & Trade).
In spite of the previous significant increase, US exports of e-vehicles to Belgium felt the hit of the pandemic, showing a year-over-year contraction of -22.5% in 2020. On the contrary, the German market proved more resilient, as imports did not fall throghout the pandemic year but actually showed a significant increase; lower, but yet positive growth for Canadian imports.
Given the current performance, it seems that the trade of electric cars between the two shores of the Atlantic is poised to remain significant for some years to come.
Conclusions
Environmental goods undoubtedly play a leading role in the shift to a green economy, and trade could be key to accelerate their diffusion across the globe, to progressively achieve the common goal of increased sustainability.
Unlike former President Trump, the new American administration seems willing to make climate a central issue. Data show the US environmental industry is highly valued in international markets, as countries recognize the quality of US technologies. That is also fostering domestic job creation: in the United States, approximately 114,000 enterprises and 1.6 million workers make up the industry – according to Environmental Business International. Furthermore, small and medium-sized companies are key drivers of environmental innovation. Though large enterprises generate the highest revenues, SMEs account for 99 percent of the environmental industry.
Export opportunities for American producers are considerable. Still, investments should continue flowing into the sector to prevent 2020s from becoming another lost decade for climate protection.
Potrebbero interessarti anche:

US-China Phase One Deal: Tracking Progress H1-2021
Pubblicato da Gloria Zambelli. .
United States of America Slowdown Free trade agreements Asia Global Economic TrendsU.S. exports to China are not flourishing despite the commitment with the "Phase One" agreement [ leggi tutto ]
US Vehicles Components: an Update
Pubblicato da Gloria Zambelli. .
United States of America Importexport Electronics Automotive Global Economic TrendsEconomic recovery proceeds, although still marked by uncertainty [ leggi tutto ]
US Export Trends: Q2-2021 Figures
Pubblicato da Lorenzo Fontanelli. .
United States of America Macroeconomic analysis Importexport Global demand Global Economic TrendsExports during 2021-Q2 hit record high as they outpace pre-pandemic levels. Growing demand for American-made food and electronic parts [ leggi tutto ]